Vietnamese vs Immigrants from Somalia Unemployment Among Women with Children Ages 6 to 17 years
COMPARE
Vietnamese
Immigrants from Somalia
Unemployment Among Women with Children Ages 6 to 17 years
Unemployment Among Women with Children Ages 6 to 17 years Comparison
Vietnamese
Immigrants from Somalia
8.9%
UNEMPLOYMENT AMONG WOMEN WITH CHILDREN AGES 6 TO 17 YEARS
72.1/ 100
METRIC RATING
154th/ 347
METRIC RANK
8.0%
UNEMPLOYMENT AMONG WOMEN WITH CHILDREN AGES 6 TO 17 YEARS
100.0/ 100
METRIC RATING
42nd/ 347
METRIC RANK
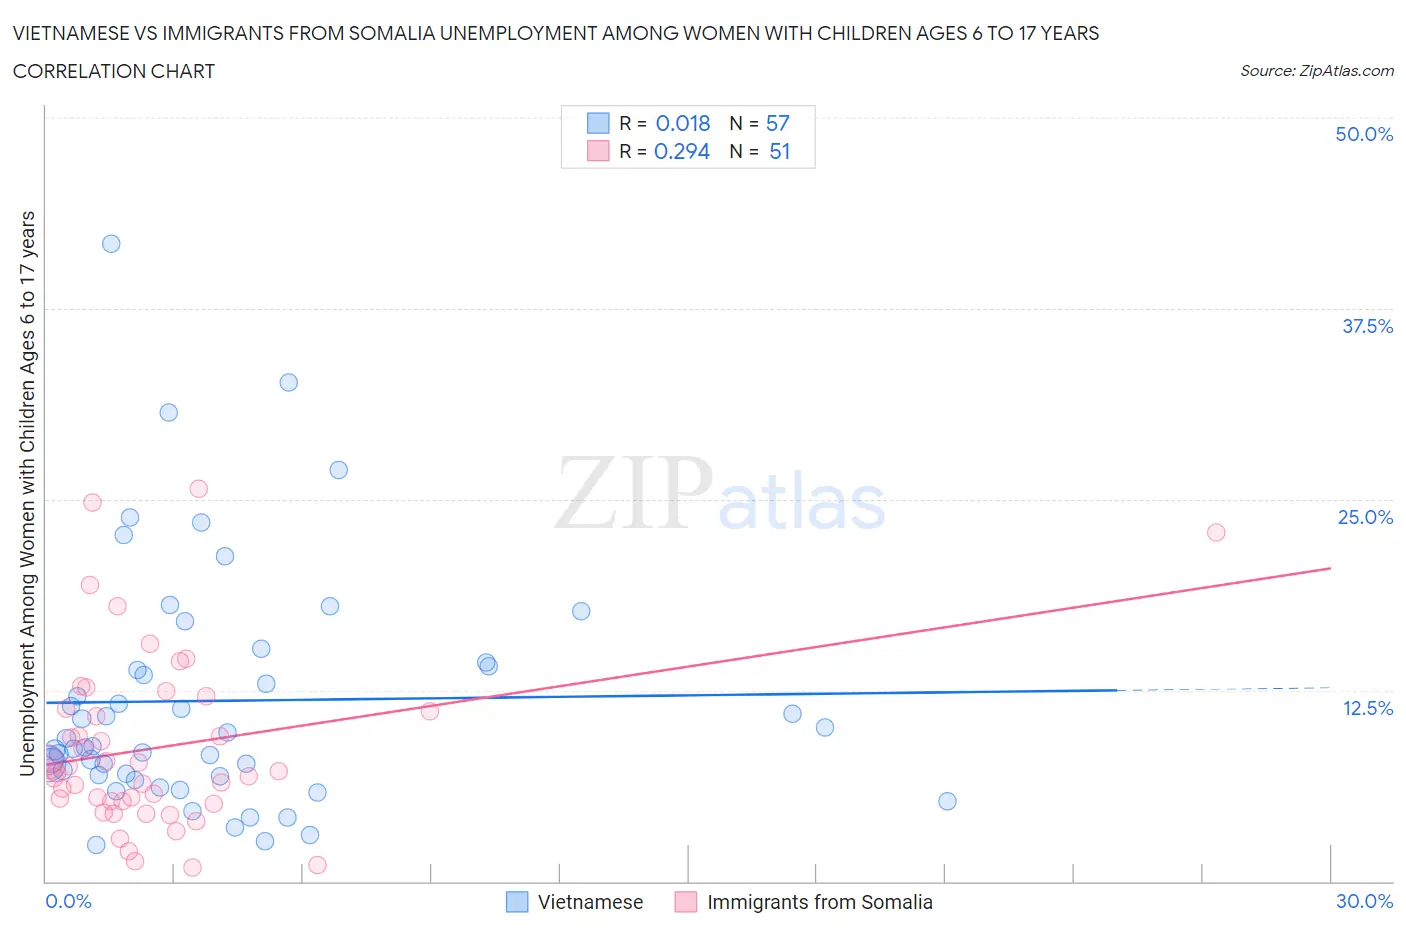
Vietnamese vs Immigrants from Somalia Unemployment Among Women with Children Ages 6 to 17 years Correlation Chart
The statistical analysis conducted on geographies consisting of 144,141,826 people shows no correlation between the proportion of Vietnamese and unemployment rate among women with children between the ages 6 and 17 in the United States with a correlation coefficient (R) of 0.018 and weighted average of 8.9%. Similarly, the statistical analysis conducted on geographies consisting of 81,291,755 people shows a weak positive correlation between the proportion of Immigrants from Somalia and unemployment rate among women with children between the ages 6 and 17 in the United States with a correlation coefficient (R) of 0.294 and weighted average of 8.0%, a difference of 10.2%.
Unemployment Among Women with Children Ages 6 to 17 years Correlation Summary
| Measurement | Vietnamese | Immigrants from Somalia |
| Minimum | 2.4% | 0.90% |
| Maximum | 41.7% | 25.7% |
| Range | 39.3% | 24.8% |
| Mean | 11.8% | 8.8% |
| Median | 8.8% | 7.2% |
| Interquartile 25% (IQ1) | 6.9% | 5.2% |
| Interquartile 75% (IQ3) | 14.2% | 11.3% |
| Interquartile Range (IQR) | 7.3% | 6.1% |
| Standard Deviation (Sample) | 7.9% | 5.7% |
| Standard Deviation (Population) | 7.9% | 5.7% |
Similar Demographics by Unemployment Among Women with Children Ages 6 to 17 years
Demographics Similar to Vietnamese by Unemployment Among Women with Children Ages 6 to 17 years
In terms of unemployment among women with children ages 6 to 17 years, the demographic groups most similar to Vietnamese are Immigrants from Greece (8.9%, a difference of 0.020%), Immigrants from Europe (8.9%, a difference of 0.070%), Immigrants from Eastern Africa (8.9%, a difference of 0.14%), Immigrants from Northern Europe (8.9%, a difference of 0.14%), and Greek (8.9%, a difference of 0.18%).
| Demographics | Rating | Rank | Unemployment Among Women with Children Ages 6 to 17 years |
| Immigrants | Bangladesh | 79.4 /100 | #147 | Good 8.8% |
| Costa Ricans | 77.0 /100 | #148 | Good 8.8% |
| Croatians | 76.0 /100 | #149 | Good 8.8% |
| Greeks | 75.2 /100 | #150 | Good 8.9% |
| Immigrants | Eastern Africa | 74.6 /100 | #151 | Good 8.9% |
| Immigrants | Northern Europe | 74.6 /100 | #152 | Good 8.9% |
| Immigrants | Europe | 73.4 /100 | #153 | Good 8.9% |
| Vietnamese | 72.1 /100 | #154 | Good 8.9% |
| Immigrants | Greece | 71.8 /100 | #155 | Good 8.9% |
| Osage | 65.9 /100 | #156 | Good 8.9% |
| Immigrants | Belgium | 65.6 /100 | #157 | Good 8.9% |
| Immigrants | Chile | 65.3 /100 | #158 | Good 8.9% |
| Spanish | 63.8 /100 | #159 | Good 8.9% |
| Immigrants | Hungary | 63.4 /100 | #160 | Good 8.9% |
| Immigrants | Guyana | 63.0 /100 | #161 | Good 8.9% |
Demographics Similar to Immigrants from Somalia by Unemployment Among Women with Children Ages 6 to 17 years
In terms of unemployment among women with children ages 6 to 17 years, the demographic groups most similar to Immigrants from Somalia are Bhutanese (8.1%, a difference of 0.14%), Immigrants from Sweden (8.1%, a difference of 0.18%), Immigrants from Bulgaria (8.1%, a difference of 0.22%), Icelander (8.1%, a difference of 0.24%), and Iranian (8.0%, a difference of 0.27%).
| Demographics | Rating | Rank | Unemployment Among Women with Children Ages 6 to 17 years |
| Immigrants | South Central Asia | 100.0 /100 | #35 | Exceptional 7.9% |
| Burmese | 100.0 /100 | #36 | Exceptional 8.0% |
| Asians | 100.0 /100 | #37 | Exceptional 8.0% |
| Alsatians | 100.0 /100 | #38 | Exceptional 8.0% |
| Somalis | 100.0 /100 | #39 | Exceptional 8.0% |
| Immigrants | Zimbabwe | 100.0 /100 | #40 | Exceptional 8.0% |
| Iranians | 100.0 /100 | #41 | Exceptional 8.0% |
| Immigrants | Somalia | 100.0 /100 | #42 | Exceptional 8.0% |
| Bhutanese | 100.0 /100 | #43 | Exceptional 8.1% |
| Immigrants | Sweden | 100.0 /100 | #44 | Exceptional 8.1% |
| Immigrants | Bulgaria | 100.0 /100 | #45 | Exceptional 8.1% |
| Icelanders | 100.0 /100 | #46 | Exceptional 8.1% |
| Immigrants | Switzerland | 100.0 /100 | #47 | Exceptional 8.1% |
| Immigrants | Asia | 100.0 /100 | #48 | Exceptional 8.1% |
| Immigrants | Oceania | 100.0 /100 | #49 | Exceptional 8.1% |