Albanian vs Colville Unemployment Among Women with Children Ages 6 to 17 years
COMPARE
Albanian
Colville
Unemployment Among Women with Children Ages 6 to 17 years
Unemployment Among Women with Children Ages 6 to 17 years Comparison
Albanians
Colville
8.6%
UNEMPLOYMENT AMONG WOMEN WITH CHILDREN AGES 6 TO 17 YEARS
96.3/ 100
METRIC RATING
117th/ 347
METRIC RANK
12.3%
UNEMPLOYMENT AMONG WOMEN WITH CHILDREN AGES 6 TO 17 YEARS
0.0/ 100
METRIC RATING
335th/ 347
METRIC RANK
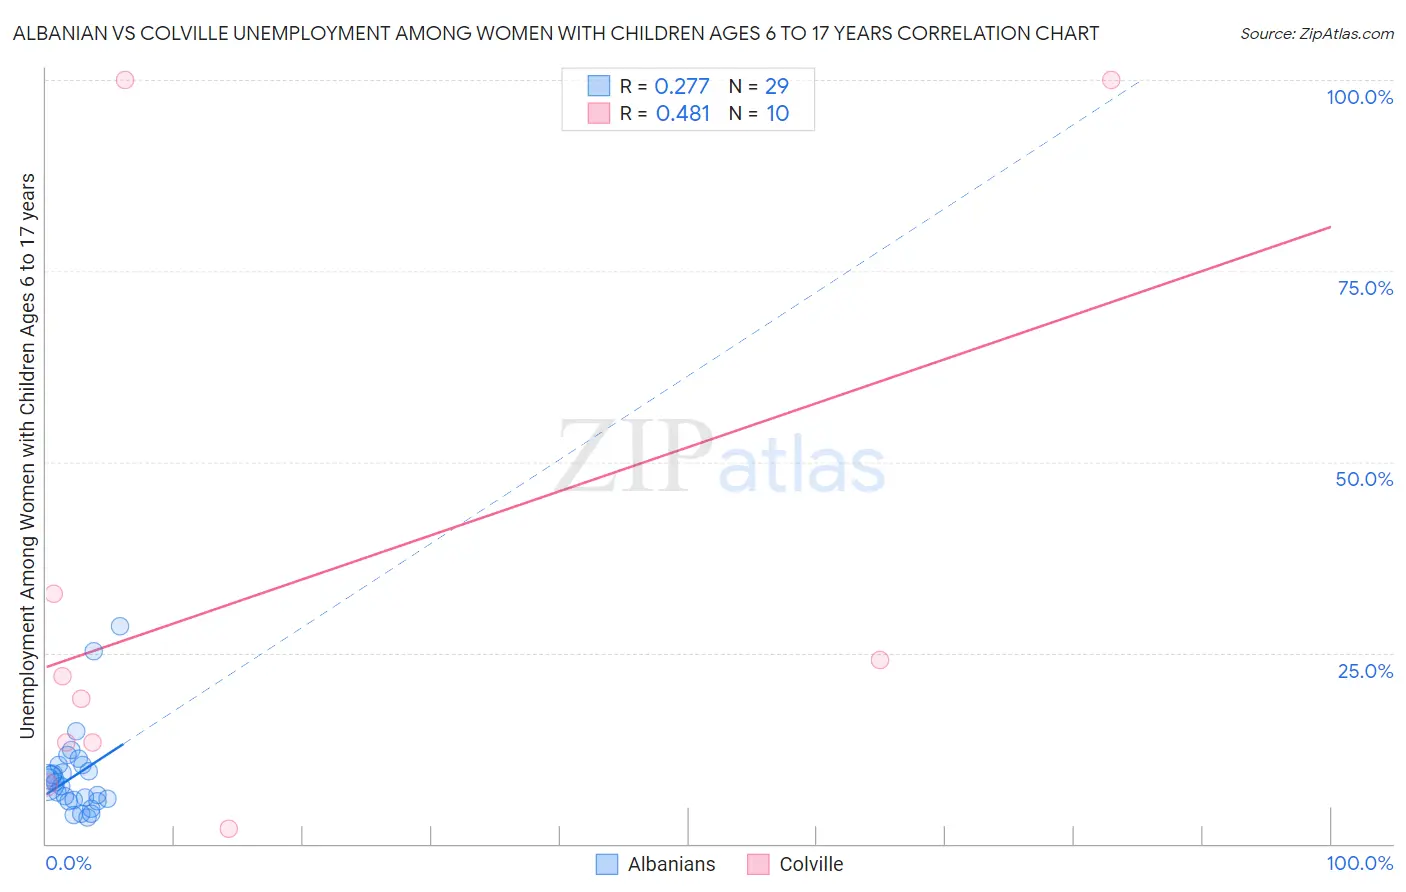
Albanian vs Colville Unemployment Among Women with Children Ages 6 to 17 years Correlation Chart
The statistical analysis conducted on geographies consisting of 149,986,101 people shows a weak positive correlation between the proportion of Albanians and unemployment rate among women with children between the ages 6 and 17 in the United States with a correlation coefficient (R) of 0.277 and weighted average of 8.6%. Similarly, the statistical analysis conducted on geographies consisting of 31,705,481 people shows a moderate positive correlation between the proportion of Colville and unemployment rate among women with children between the ages 6 and 17 in the United States with a correlation coefficient (R) of 0.481 and weighted average of 12.3%, a difference of 42.9%.
Unemployment Among Women with Children Ages 6 to 17 years Correlation Summary
| Measurement | Albanian | Colville |
| Minimum | 3.5% | 2.0% |
| Maximum | 28.5% | 100.0% |
| Range | 25.0% | 98.0% |
| Mean | 9.0% | 33.4% |
| Median | 8.0% | 20.5% |
| Interquartile 25% (IQ1) | 5.6% | 13.3% |
| Interquartile 75% (IQ3) | 10.4% | 32.7% |
| Interquartile Range (IQR) | 4.7% | 19.4% |
| Standard Deviation (Sample) | 5.7% | 36.1% |
| Standard Deviation (Population) | 5.6% | 34.3% |
Similar Demographics by Unemployment Among Women with Children Ages 6 to 17 years
Demographics Similar to Albanians by Unemployment Among Women with Children Ages 6 to 17 years
In terms of unemployment among women with children ages 6 to 17 years, the demographic groups most similar to Albanians are Zimbabwean (8.6%, a difference of 0.010%), Pueblo (8.6%, a difference of 0.030%), Immigrants from Grenada (8.6%, a difference of 0.040%), Argentinean (8.6%, a difference of 0.080%), and Israeli (8.7%, a difference of 0.12%).
| Demographics | Rating | Rank | Unemployment Among Women with Children Ages 6 to 17 years |
| Latvians | 97.4 /100 | #110 | Exceptional 8.6% |
| Immigrants | Ukraine | 97.4 /100 | #111 | Exceptional 8.6% |
| Romanians | 97.1 /100 | #112 | Exceptional 8.6% |
| Eastern Europeans | 96.8 /100 | #113 | Exceptional 8.6% |
| Immigrants | Russia | 96.7 /100 | #114 | Exceptional 8.6% |
| Argentineans | 96.5 /100 | #115 | Exceptional 8.6% |
| Zimbabweans | 96.3 /100 | #116 | Exceptional 8.6% |
| Albanians | 96.3 /100 | #117 | Exceptional 8.6% |
| Pueblo | 96.2 /100 | #118 | Exceptional 8.6% |
| Immigrants | Grenada | 96.2 /100 | #119 | Exceptional 8.6% |
| Israelis | 95.9 /100 | #120 | Exceptional 8.7% |
| Immigrants | Denmark | 95.5 /100 | #121 | Exceptional 8.7% |
| Immigrants | Egypt | 95.0 /100 | #122 | Exceptional 8.7% |
| Immigrants | Morocco | 94.9 /100 | #123 | Exceptional 8.7% |
| Immigrants | Lebanon | 94.9 /100 | #124 | Exceptional 8.7% |
Demographics Similar to Colville by Unemployment Among Women with Children Ages 6 to 17 years
In terms of unemployment among women with children ages 6 to 17 years, the demographic groups most similar to Colville are Houma (12.5%, a difference of 0.97%), Ugandan (12.0%, a difference of 2.7%), Immigrants from Yemen (12.7%, a difference of 2.9%), Hopi (12.9%, a difference of 4.4%), and Sioux (13.2%, a difference of 7.2%).
| Demographics | Rating | Rank | Unemployment Among Women with Children Ages 6 to 17 years |
| Ottawa | 0.0 /100 | #328 | Tragic 10.9% |
| Pennsylvania Germans | 0.0 /100 | #329 | Tragic 11.0% |
| Chippewa | 0.0 /100 | #330 | Tragic 11.1% |
| Blacks/African Americans | 0.0 /100 | #331 | Tragic 11.4% |
| Tsimshian | 0.0 /100 | #332 | Tragic 11.4% |
| Natives/Alaskans | 0.0 /100 | #333 | Tragic 11.5% |
| Ugandans | 0.0 /100 | #334 | Tragic 12.0% |
| Colville | 0.0 /100 | #335 | Tragic 12.3% |
| Houma | 0.0 /100 | #336 | Tragic 12.5% |
| Immigrants | Yemen | 0.0 /100 | #337 | Tragic 12.7% |
| Hopi | 0.0 /100 | #338 | Tragic 12.9% |
| Sioux | 0.0 /100 | #339 | Tragic 13.2% |
| Puerto Ricans | 0.0 /100 | #340 | Tragic 13.9% |
| Navajo | 0.0 /100 | #341 | Tragic 14.2% |
| Yuman | 0.0 /100 | #342 | Tragic 14.8% |