Ute vs Immigrants from St. Vincent and the Grenadines Male Unemployment
COMPARE
Ute
Immigrants from St. Vincent and the Grenadines
Male Unemployment
Male Unemployment Comparison
Ute
Immigrants from St. Vincent and the Grenadines
6.6%
MALE UNEMPLOYMENT
0.0/ 100
METRIC RATING
302nd/ 347
METRIC RANK
7.5%
MALE UNEMPLOYMENT
0.0/ 100
METRIC RATING
321st/ 347
METRIC RANK
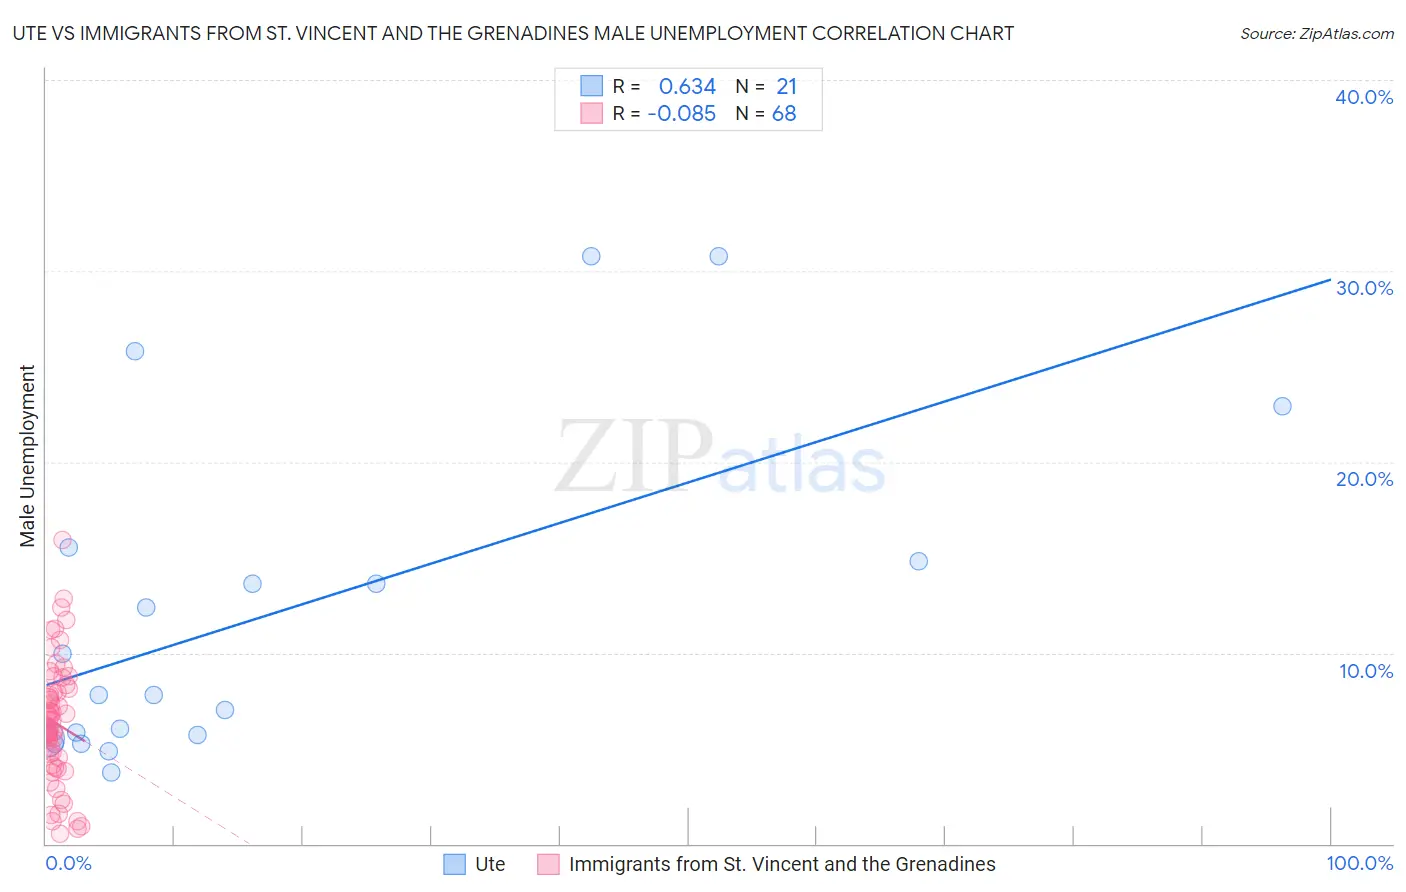
Ute vs Immigrants from St. Vincent and the Grenadines Male Unemployment Correlation Chart
The statistical analysis conducted on geographies consisting of 55,563,809 people shows a significant positive correlation between the proportion of Ute and unemployment rate among males in the United States with a correlation coefficient (R) of 0.634 and weighted average of 6.6%. Similarly, the statistical analysis conducted on geographies consisting of 56,141,446 people shows a slight negative correlation between the proportion of Immigrants from St. Vincent and the Grenadines and unemployment rate among males in the United States with a correlation coefficient (R) of -0.085 and weighted average of 7.5%, a difference of 12.5%.
Male Unemployment Correlation Summary
| Measurement | Ute | Immigrants from St. Vincent and the Grenadines |
| Minimum | 3.7% | 0.50% |
| Maximum | 30.8% | 15.9% |
| Range | 27.1% | 15.4% |
| Mean | 12.1% | 6.3% |
| Median | 7.8% | 6.1% |
| Interquartile 25% (IQ1) | 5.6% | 4.6% |
| Interquartile 75% (IQ3) | 15.2% | 7.9% |
| Interquartile Range (IQR) | 9.6% | 3.3% |
| Standard Deviation (Sample) | 8.6% | 3.1% |
| Standard Deviation (Population) | 8.4% | 3.1% |
Demographics Similar to Ute and Immigrants from St. Vincent and the Grenadines by Male Unemployment
In terms of male unemployment, the demographic groups most similar to Ute are Immigrants from West Indies (6.7%, a difference of 0.36%), West Indian (6.7%, a difference of 0.37%), Trinidadian and Tobagonian (6.7%, a difference of 0.69%), Immigrants from Belize (6.6%, a difference of 0.71%), and Immigrants from Trinidad and Tobago (6.7%, a difference of 0.89%). Similarly, the demographic groups most similar to Immigrants from St. Vincent and the Grenadines are Colville (7.4%, a difference of 1.4%), British West Indian (7.3%, a difference of 2.3%), Cape Verdean (7.1%, a difference of 4.9%), Guyanese (7.1%, a difference of 4.9%), and Immigrants from Guyana (7.1%, a difference of 5.0%).
| Demographics | Rating | Rank | Male Unemployment |
| Immigrants | Belize | 0.0 /100 | #301 | Tragic 6.6% |
| Ute | 0.0 /100 | #302 | Tragic 6.6% |
| Immigrants | West Indies | 0.0 /100 | #303 | Tragic 6.7% |
| West Indians | 0.0 /100 | #304 | Tragic 6.7% |
| Trinidadians and Tobagonians | 0.0 /100 | #305 | Tragic 6.7% |
| Immigrants | Trinidad and Tobago | 0.0 /100 | #306 | Tragic 6.7% |
| Immigrants | Jamaica | 0.0 /100 | #307 | Tragic 6.7% |
| Aleuts | 0.0 /100 | #308 | Tragic 6.8% |
| Barbadians | 0.0 /100 | #309 | Tragic 6.9% |
| Blacks/African Americans | 0.0 /100 | #310 | Tragic 6.9% |
| Immigrants | Armenia | 0.0 /100 | #311 | Tragic 6.9% |
| Lumbee | 0.0 /100 | #312 | Tragic 6.9% |
| Immigrants | Dominica | 0.0 /100 | #313 | Tragic 7.0% |
| Immigrants | Barbados | 0.0 /100 | #314 | Tragic 7.1% |
| Houma | 0.0 /100 | #315 | Tragic 7.1% |
| Immigrants | Guyana | 0.0 /100 | #316 | Tragic 7.1% |
| Guyanese | 0.0 /100 | #317 | Tragic 7.1% |
| Cape Verdeans | 0.0 /100 | #318 | Tragic 7.1% |
| British West Indians | 0.0 /100 | #319 | Tragic 7.3% |
| Colville | 0.0 /100 | #320 | Tragic 7.4% |
| Immigrants | St. Vincent and the Grenadines | 0.0 /100 | #321 | Tragic 7.5% |