Ute vs Arapaho Male Unemployment
COMPARE
Ute
Arapaho
Male Unemployment
Male Unemployment Comparison
Ute
Arapaho
6.6%
MALE UNEMPLOYMENT
0.0/ 100
METRIC RATING
302nd/ 347
METRIC RANK
11.0%
MALE UNEMPLOYMENT
0.0/ 100
METRIC RATING
345th/ 347
METRIC RANK
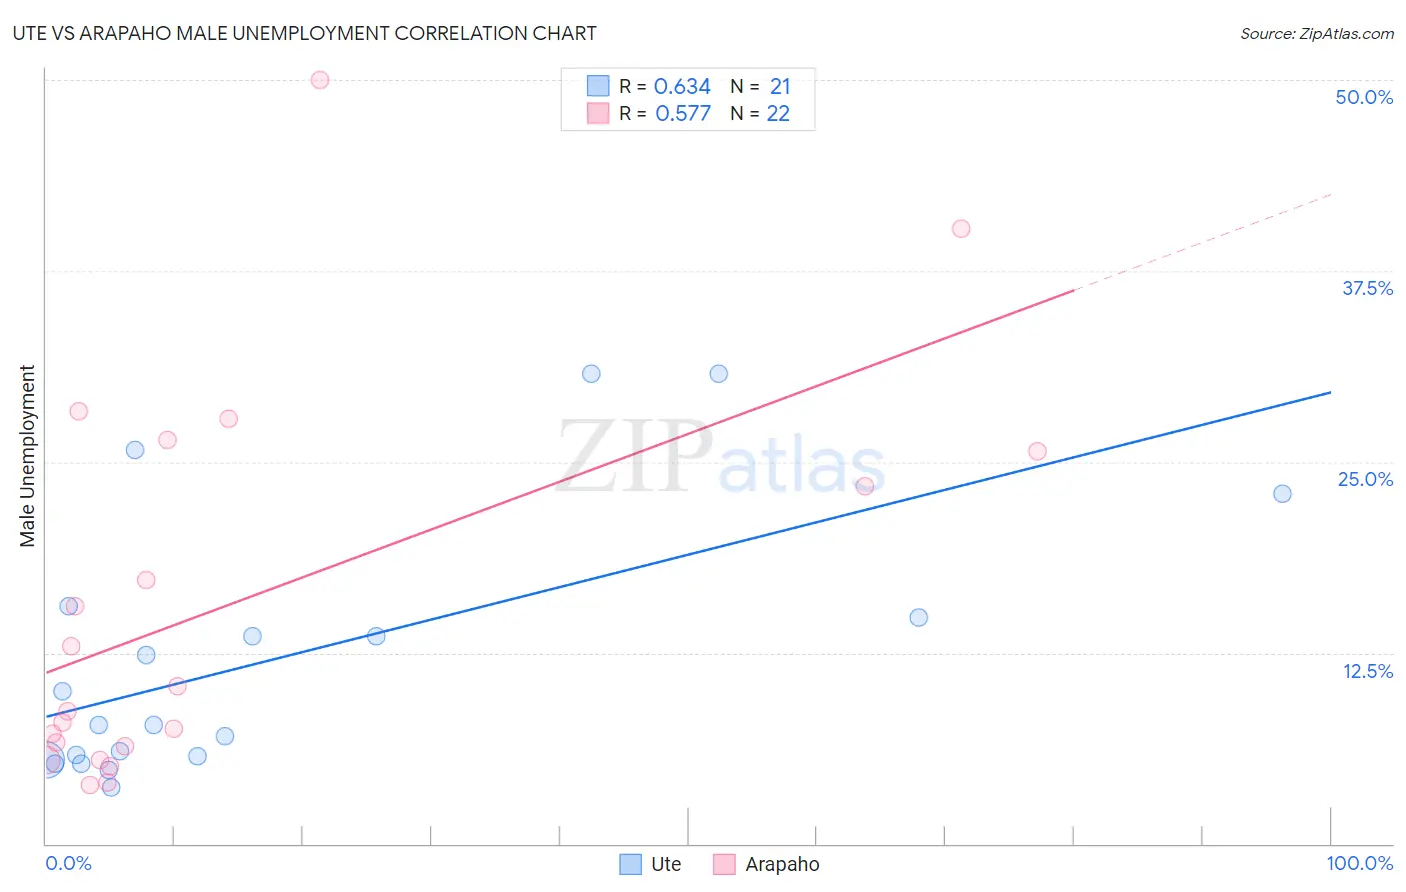
Ute vs Arapaho Male Unemployment Correlation Chart
The statistical analysis conducted on geographies consisting of 55,563,809 people shows a significant positive correlation between the proportion of Ute and unemployment rate among males in the United States with a correlation coefficient (R) of 0.634 and weighted average of 6.6%. Similarly, the statistical analysis conducted on geographies consisting of 29,745,830 people shows a substantial positive correlation between the proportion of Arapaho and unemployment rate among males in the United States with a correlation coefficient (R) of 0.577 and weighted average of 11.0%, a difference of 65.7%.
Male Unemployment Correlation Summary
| Measurement | Ute | Arapaho |
| Minimum | 3.7% | 3.9% |
| Maximum | 30.8% | 50.0% |
| Range | 27.1% | 46.1% |
| Mean | 12.1% | 15.7% |
| Median | 7.8% | 9.5% |
| Interquartile 25% (IQ1) | 5.6% | 6.4% |
| Interquartile 75% (IQ3) | 15.2% | 25.7% |
| Interquartile Range (IQR) | 9.6% | 19.3% |
| Standard Deviation (Sample) | 8.6% | 12.8% |
| Standard Deviation (Population) | 8.4% | 12.5% |
Similar Demographics by Male Unemployment
Demographics Similar to Ute by Male Unemployment
In terms of male unemployment, the demographic groups most similar to Ute are Immigrants from West Indies (6.7%, a difference of 0.36%), West Indian (6.7%, a difference of 0.37%), Trinidadian and Tobagonian (6.7%, a difference of 0.69%), Immigrants from Belize (6.6%, a difference of 0.71%), and Vietnamese (6.6%, a difference of 0.82%).
| Demographics | Rating | Rank | Male Unemployment |
| Belizeans | 0.0 /100 | #295 | Tragic 6.5% |
| Immigrants | Haiti | 0.0 /100 | #296 | Tragic 6.5% |
| Chippewa | 0.0 /100 | #297 | Tragic 6.6% |
| Jamaicans | 0.0 /100 | #298 | Tragic 6.6% |
| Immigrants | Bangladesh | 0.0 /100 | #299 | Tragic 6.6% |
| Vietnamese | 0.0 /100 | #300 | Tragic 6.6% |
| Immigrants | Belize | 0.0 /100 | #301 | Tragic 6.6% |
| Ute | 0.0 /100 | #302 | Tragic 6.6% |
| Immigrants | West Indies | 0.0 /100 | #303 | Tragic 6.7% |
| West Indians | 0.0 /100 | #304 | Tragic 6.7% |
| Trinidadians and Tobagonians | 0.0 /100 | #305 | Tragic 6.7% |
| Immigrants | Trinidad and Tobago | 0.0 /100 | #306 | Tragic 6.7% |
| Immigrants | Jamaica | 0.0 /100 | #307 | Tragic 6.7% |
| Aleuts | 0.0 /100 | #308 | Tragic 6.8% |
| Barbadians | 0.0 /100 | #309 | Tragic 6.9% |
Demographics Similar to Arapaho by Male Unemployment
In terms of male unemployment, the demographic groups most similar to Arapaho are Hopi (10.8%, a difference of 2.0%), Crow (10.6%, a difference of 3.7%), Tohono O'odham (10.2%, a difference of 8.2%), Inupiat (12.1%, a difference of 9.8%), and Navajo (9.8%, a difference of 11.9%).
| Demographics | Rating | Rank | Male Unemployment |
| Sioux | 0.0 /100 | #333 | Tragic 8.4% |
| Tsimshian | 0.0 /100 | #334 | Tragic 8.5% |
| Pueblo | 0.0 /100 | #335 | Tragic 8.5% |
| Yuman | 0.0 /100 | #336 | Tragic 8.6% |
| Puerto Ricans | 0.0 /100 | #337 | Tragic 8.6% |
| Apache | 0.0 /100 | #338 | Tragic 8.6% |
| Cheyenne | 0.0 /100 | #339 | Tragic 9.8% |
| Alaskan Athabascans | 0.0 /100 | #340 | Tragic 9.8% |
| Navajo | 0.0 /100 | #341 | Tragic 9.8% |
| Tohono O'odham | 0.0 /100 | #342 | Tragic 10.2% |
| Crow | 0.0 /100 | #343 | Tragic 10.6% |
| Hopi | 0.0 /100 | #344 | Tragic 10.8% |
| Arapaho | 0.0 /100 | #345 | Tragic 11.0% |
| Inupiat | 0.0 /100 | #346 | Tragic 12.1% |
| Yup'ik | 0.0 /100 | #347 | Tragic 16.4% |