Immigrants from Micronesia vs Belgian Male Unemployment
COMPARE
Immigrants from Micronesia
Belgian
Male Unemployment
Male Unemployment Comparison
Immigrants from Micronesia
Belgians
5.6%
MALE UNEMPLOYMENT
2.9/ 100
METRIC RATING
222nd/ 347
METRIC RANK
4.8%
MALE UNEMPLOYMENT
99.9/ 100
METRIC RATING
27th/ 347
METRIC RANK
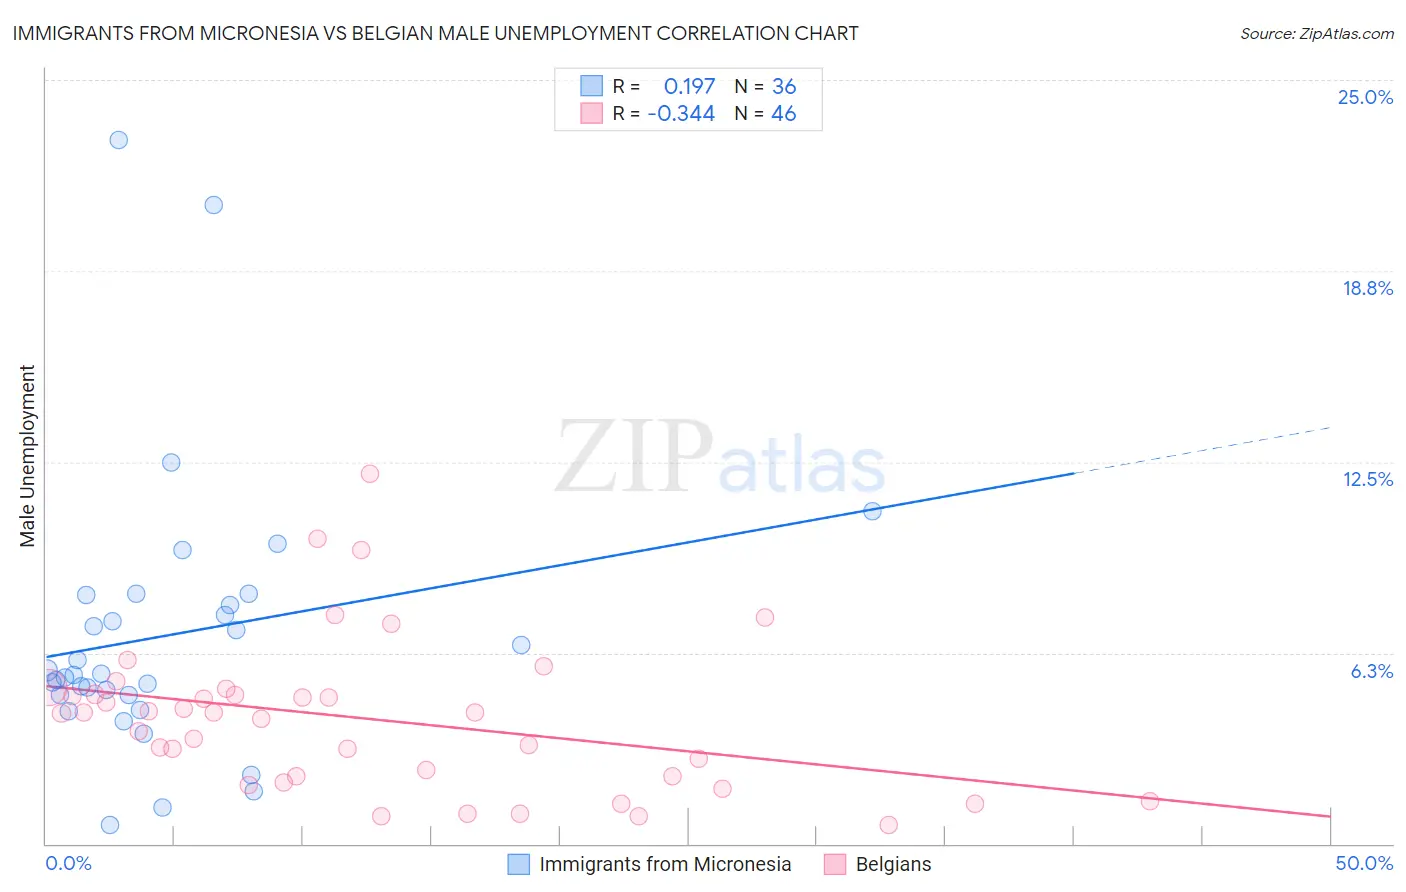
Immigrants from Micronesia vs Belgian Male Unemployment Correlation Chart
The statistical analysis conducted on geographies consisting of 61,517,002 people shows a poor positive correlation between the proportion of Immigrants from Micronesia and unemployment rate among males in the United States with a correlation coefficient (R) of 0.197 and weighted average of 5.6%. Similarly, the statistical analysis conducted on geographies consisting of 354,096,241 people shows a mild negative correlation between the proportion of Belgians and unemployment rate among males in the United States with a correlation coefficient (R) of -0.344 and weighted average of 4.8%, a difference of 16.2%.
Male Unemployment Correlation Summary
| Measurement | Immigrants from Micronesia | Belgian |
| Minimum | 0.60% | 0.60% |
| Maximum | 23.0% | 12.1% |
| Range | 22.4% | 11.5% |
| Mean | 6.8% | 4.1% |
| Median | 5.5% | 4.3% |
| Interquartile 25% (IQ1) | 4.9% | 2.2% |
| Interquartile 75% (IQ3) | 8.0% | 4.9% |
| Interquartile Range (IQR) | 3.1% | 2.7% |
| Standard Deviation (Sample) | 4.5% | 2.5% |
| Standard Deviation (Population) | 4.4% | 2.5% |
Similar Demographics by Male Unemployment
Demographics Similar to Immigrants from Micronesia by Male Unemployment
In terms of male unemployment, the demographic groups most similar to Immigrants from Micronesia are Soviet Union (5.6%, a difference of 0.14%), Creek (5.6%, a difference of 0.15%), Portuguese (5.6%, a difference of 0.25%), Immigrants from Western Asia (5.6%, a difference of 0.27%), and Cherokee (5.6%, a difference of 0.28%).
| Demographics | Rating | Rank | Male Unemployment |
| Samoans | 4.9 /100 | #215 | Tragic 5.5% |
| Immigrants | Immigrants | 4.3 /100 | #216 | Tragic 5.5% |
| Delaware | 4.2 /100 | #217 | Tragic 5.5% |
| Immigrants | Albania | 3.6 /100 | #218 | Tragic 5.5% |
| Immigrants | Western Asia | 3.5 /100 | #219 | Tragic 5.6% |
| Portuguese | 3.5 /100 | #220 | Tragic 5.6% |
| Soviet Union | 3.2 /100 | #221 | Tragic 5.6% |
| Immigrants | Micronesia | 2.9 /100 | #222 | Tragic 5.6% |
| Creek | 2.6 /100 | #223 | Tragic 5.6% |
| Cherokee | 2.4 /100 | #224 | Tragic 5.6% |
| Panamanians | 1.9 /100 | #225 | Tragic 5.6% |
| Immigrants | Cambodia | 1.8 /100 | #226 | Tragic 5.6% |
| Immigrants | Panama | 1.8 /100 | #227 | Tragic 5.6% |
| Seminole | 1.8 /100 | #228 | Tragic 5.6% |
| Central Americans | 1.8 /100 | #229 | Tragic 5.6% |
Demographics Similar to Belgians by Male Unemployment
In terms of male unemployment, the demographic groups most similar to Belgians are Bulgarian (4.8%, a difference of 0.18%), Dutch (4.8%, a difference of 0.20%), Zimbabwean (4.8%, a difference of 0.22%), Immigrants from South Central Asia (4.8%, a difference of 0.32%), and Scottish (4.8%, a difference of 0.32%).
| Demographics | Rating | Rank | Male Unemployment |
| Pennsylvania Germans | 99.9 /100 | #20 | Exceptional 4.8% |
| Immigrants | Taiwan | 99.9 /100 | #21 | Exceptional 4.8% |
| Carpatho Rusyns | 99.9 /100 | #22 | Exceptional 4.8% |
| Tongans | 99.9 /100 | #23 | Exceptional 4.8% |
| Immigrants | South Central Asia | 99.9 /100 | #24 | Exceptional 4.8% |
| Zimbabweans | 99.9 /100 | #25 | Exceptional 4.8% |
| Dutch | 99.9 /100 | #26 | Exceptional 4.8% |
| Belgians | 99.9 /100 | #27 | Exceptional 4.8% |
| Bulgarians | 99.8 /100 | #28 | Exceptional 4.8% |
| Scottish | 99.8 /100 | #29 | Exceptional 4.8% |
| British | 99.8 /100 | #30 | Exceptional 4.8% |
| Sudanese | 99.8 /100 | #31 | Exceptional 4.8% |
| Immigrants | Nepal | 99.8 /100 | #32 | Exceptional 4.8% |
| Latvians | 99.7 /100 | #33 | Exceptional 4.8% |
| Welsh | 99.7 /100 | #34 | Exceptional 4.8% |