Ute vs Immigrants from Micronesia Male Unemployment
COMPARE
Ute
Immigrants from Micronesia
Male Unemployment
Male Unemployment Comparison
Ute
Immigrants from Micronesia
6.6%
MALE UNEMPLOYMENT
0.0/ 100
METRIC RATING
302nd/ 347
METRIC RANK
5.6%
MALE UNEMPLOYMENT
2.9/ 100
METRIC RATING
222nd/ 347
METRIC RANK
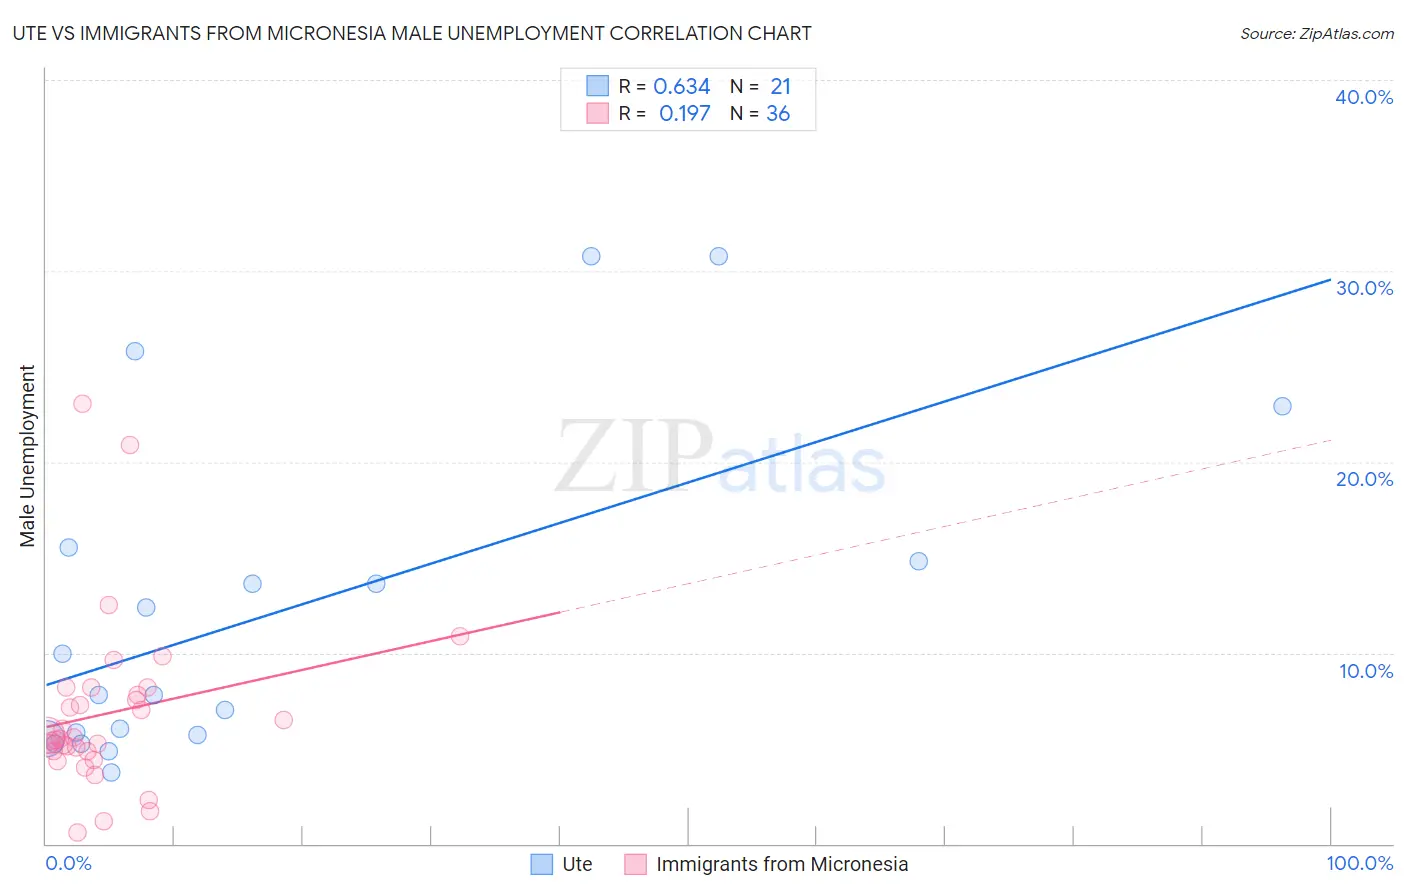
Ute vs Immigrants from Micronesia Male Unemployment Correlation Chart
The statistical analysis conducted on geographies consisting of 55,563,809 people shows a significant positive correlation between the proportion of Ute and unemployment rate among males in the United States with a correlation coefficient (R) of 0.634 and weighted average of 6.6%. Similarly, the statistical analysis conducted on geographies consisting of 61,517,002 people shows a poor positive correlation between the proportion of Immigrants from Micronesia and unemployment rate among males in the United States with a correlation coefficient (R) of 0.197 and weighted average of 5.6%, a difference of 19.2%.
Male Unemployment Correlation Summary
| Measurement | Ute | Immigrants from Micronesia |
| Minimum | 3.7% | 0.60% |
| Maximum | 30.8% | 23.0% |
| Range | 27.1% | 22.4% |
| Mean | 12.1% | 6.8% |
| Median | 7.8% | 5.5% |
| Interquartile 25% (IQ1) | 5.6% | 4.9% |
| Interquartile 75% (IQ3) | 15.2% | 8.0% |
| Interquartile Range (IQR) | 9.6% | 3.1% |
| Standard Deviation (Sample) | 8.6% | 4.5% |
| Standard Deviation (Population) | 8.4% | 4.4% |
Similar Demographics by Male Unemployment
Demographics Similar to Ute by Male Unemployment
In terms of male unemployment, the demographic groups most similar to Ute are Immigrants from West Indies (6.7%, a difference of 0.36%), West Indian (6.7%, a difference of 0.37%), Trinidadian and Tobagonian (6.7%, a difference of 0.69%), Immigrants from Belize (6.6%, a difference of 0.71%), and Vietnamese (6.6%, a difference of 0.82%).
| Demographics | Rating | Rank | Male Unemployment |
| Belizeans | 0.0 /100 | #295 | Tragic 6.5% |
| Immigrants | Haiti | 0.0 /100 | #296 | Tragic 6.5% |
| Chippewa | 0.0 /100 | #297 | Tragic 6.6% |
| Jamaicans | 0.0 /100 | #298 | Tragic 6.6% |
| Immigrants | Bangladesh | 0.0 /100 | #299 | Tragic 6.6% |
| Vietnamese | 0.0 /100 | #300 | Tragic 6.6% |
| Immigrants | Belize | 0.0 /100 | #301 | Tragic 6.6% |
| Ute | 0.0 /100 | #302 | Tragic 6.6% |
| Immigrants | West Indies | 0.0 /100 | #303 | Tragic 6.7% |
| West Indians | 0.0 /100 | #304 | Tragic 6.7% |
| Trinidadians and Tobagonians | 0.0 /100 | #305 | Tragic 6.7% |
| Immigrants | Trinidad and Tobago | 0.0 /100 | #306 | Tragic 6.7% |
| Immigrants | Jamaica | 0.0 /100 | #307 | Tragic 6.7% |
| Aleuts | 0.0 /100 | #308 | Tragic 6.8% |
| Barbadians | 0.0 /100 | #309 | Tragic 6.9% |
Demographics Similar to Immigrants from Micronesia by Male Unemployment
In terms of male unemployment, the demographic groups most similar to Immigrants from Micronesia are Soviet Union (5.6%, a difference of 0.14%), Creek (5.6%, a difference of 0.15%), Portuguese (5.6%, a difference of 0.25%), Immigrants from Western Asia (5.6%, a difference of 0.27%), and Cherokee (5.6%, a difference of 0.28%).
| Demographics | Rating | Rank | Male Unemployment |
| Samoans | 4.9 /100 | #215 | Tragic 5.5% |
| Immigrants | Immigrants | 4.3 /100 | #216 | Tragic 5.5% |
| Delaware | 4.2 /100 | #217 | Tragic 5.5% |
| Immigrants | Albania | 3.6 /100 | #218 | Tragic 5.5% |
| Immigrants | Western Asia | 3.5 /100 | #219 | Tragic 5.6% |
| Portuguese | 3.5 /100 | #220 | Tragic 5.6% |
| Soviet Union | 3.2 /100 | #221 | Tragic 5.6% |
| Immigrants | Micronesia | 2.9 /100 | #222 | Tragic 5.6% |
| Creek | 2.6 /100 | #223 | Tragic 5.6% |
| Cherokee | 2.4 /100 | #224 | Tragic 5.6% |
| Panamanians | 1.9 /100 | #225 | Tragic 5.6% |
| Immigrants | Cambodia | 1.8 /100 | #226 | Tragic 5.6% |
| Immigrants | Panama | 1.8 /100 | #227 | Tragic 5.6% |
| Seminole | 1.8 /100 | #228 | Tragic 5.6% |
| Central Americans | 1.8 /100 | #229 | Tragic 5.6% |