Ute vs Immigrants from Bahamas Male Unemployment
COMPARE
Ute
Immigrants from Bahamas
Male Unemployment
Male Unemployment Comparison
Ute
Immigrants from Bahamas
6.6%
MALE UNEMPLOYMENT
0.0/ 100
METRIC RATING
302nd/ 347
METRIC RANK
5.7%
MALE UNEMPLOYMENT
0.4/ 100
METRIC RATING
250th/ 347
METRIC RANK
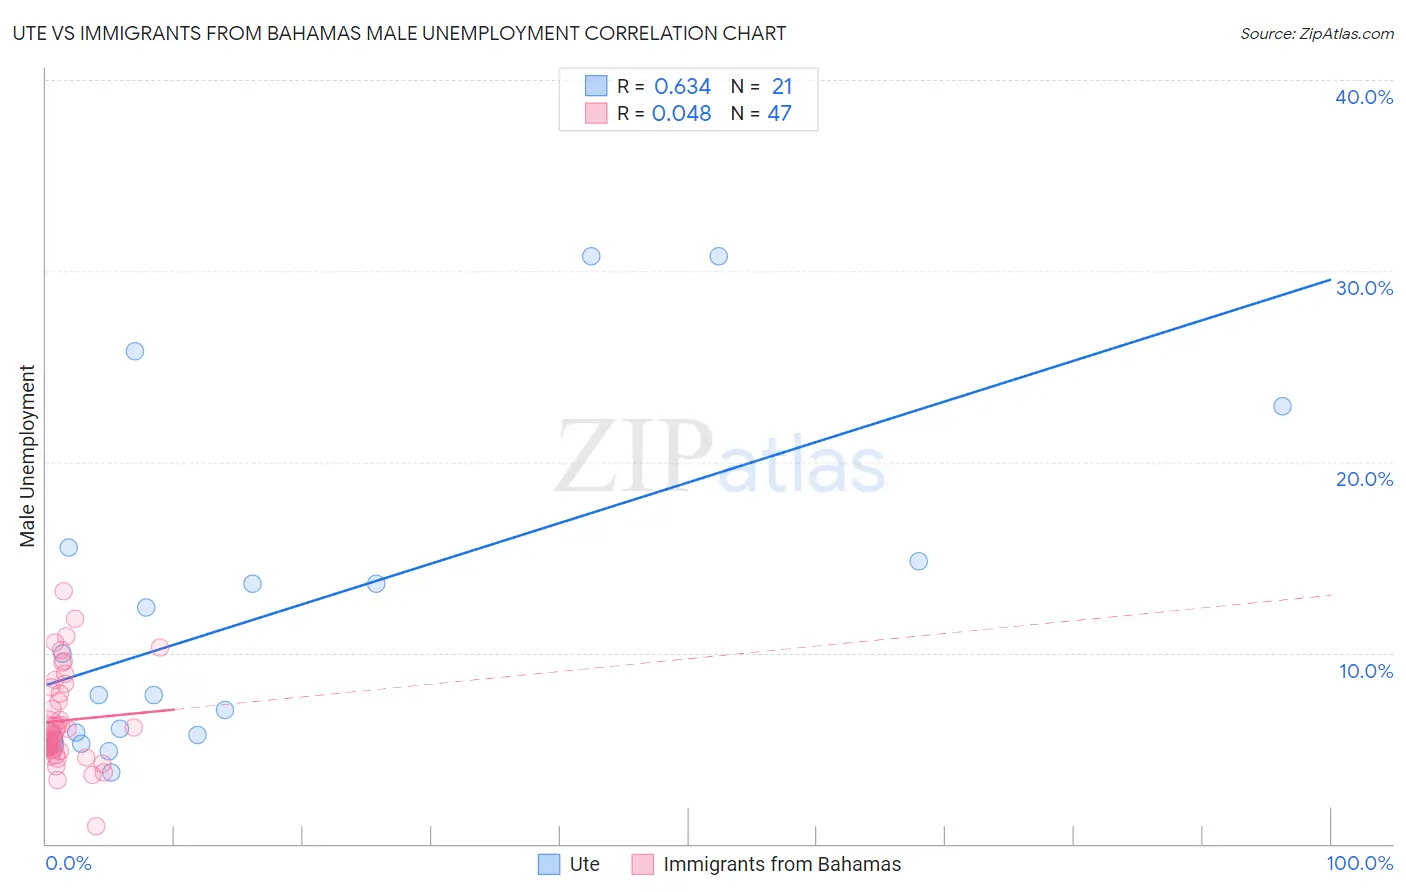
Ute vs Immigrants from Bahamas Male Unemployment Correlation Chart
The statistical analysis conducted on geographies consisting of 55,563,809 people shows a significant positive correlation between the proportion of Ute and unemployment rate among males in the United States with a correlation coefficient (R) of 0.634 and weighted average of 6.6%. Similarly, the statistical analysis conducted on geographies consisting of 104,587,349 people shows no correlation between the proportion of Immigrants from Bahamas and unemployment rate among males in the United States with a correlation coefficient (R) of 0.048 and weighted average of 5.7%, a difference of 15.8%.
Male Unemployment Correlation Summary
| Measurement | Ute | Immigrants from Bahamas |
| Minimum | 3.7% | 0.90% |
| Maximum | 30.8% | 13.2% |
| Range | 27.1% | 12.3% |
| Mean | 12.1% | 6.5% |
| Median | 7.8% | 5.9% |
| Interquartile 25% (IQ1) | 5.6% | 4.9% |
| Interquartile 75% (IQ3) | 15.2% | 8.2% |
| Interquartile Range (IQR) | 9.6% | 3.2% |
| Standard Deviation (Sample) | 8.6% | 2.5% |
| Standard Deviation (Population) | 8.4% | 2.4% |
Similar Demographics by Male Unemployment
Demographics Similar to Ute by Male Unemployment
In terms of male unemployment, the demographic groups most similar to Ute are Immigrants from West Indies (6.7%, a difference of 0.36%), West Indian (6.7%, a difference of 0.37%), Trinidadian and Tobagonian (6.7%, a difference of 0.69%), Immigrants from Belize (6.6%, a difference of 0.71%), and Vietnamese (6.6%, a difference of 0.82%).
| Demographics | Rating | Rank | Male Unemployment |
| Belizeans | 0.0 /100 | #295 | Tragic 6.5% |
| Immigrants | Haiti | 0.0 /100 | #296 | Tragic 6.5% |
| Chippewa | 0.0 /100 | #297 | Tragic 6.6% |
| Jamaicans | 0.0 /100 | #298 | Tragic 6.6% |
| Immigrants | Bangladesh | 0.0 /100 | #299 | Tragic 6.6% |
| Vietnamese | 0.0 /100 | #300 | Tragic 6.6% |
| Immigrants | Belize | 0.0 /100 | #301 | Tragic 6.6% |
| Ute | 0.0 /100 | #302 | Tragic 6.6% |
| Immigrants | West Indies | 0.0 /100 | #303 | Tragic 6.7% |
| West Indians | 0.0 /100 | #304 | Tragic 6.7% |
| Trinidadians and Tobagonians | 0.0 /100 | #305 | Tragic 6.7% |
| Immigrants | Trinidad and Tobago | 0.0 /100 | #306 | Tragic 6.7% |
| Immigrants | Jamaica | 0.0 /100 | #307 | Tragic 6.7% |
| Aleuts | 0.0 /100 | #308 | Tragic 6.8% |
| Barbadians | 0.0 /100 | #309 | Tragic 6.9% |
Demographics Similar to Immigrants from Bahamas by Male Unemployment
In terms of male unemployment, the demographic groups most similar to Immigrants from Bahamas are Spanish American (5.7%, a difference of 0.040%), Cree (5.7%, a difference of 0.24%), Marshallese (5.7%, a difference of 0.31%), Mexican (5.8%, a difference of 0.62%), and Hawaiian (5.7%, a difference of 0.63%).
| Demographics | Rating | Rank | Male Unemployment |
| Bangladeshis | 0.8 /100 | #243 | Tragic 5.7% |
| Immigrants | El Salvador | 0.7 /100 | #244 | Tragic 5.7% |
| Yaqui | 0.7 /100 | #245 | Tragic 5.7% |
| Iroquois | 0.6 /100 | #246 | Tragic 5.7% |
| Hawaiians | 0.6 /100 | #247 | Tragic 5.7% |
| Marshallese | 0.5 /100 | #248 | Tragic 5.7% |
| Cree | 0.4 /100 | #249 | Tragic 5.7% |
| Immigrants | Bahamas | 0.4 /100 | #250 | Tragic 5.7% |
| Spanish Americans | 0.3 /100 | #251 | Tragic 5.7% |
| Mexicans | 0.2 /100 | #252 | Tragic 5.8% |
| Mexican American Indians | 0.2 /100 | #253 | Tragic 5.8% |
| Japanese | 0.2 /100 | #254 | Tragic 5.8% |
| Kiowa | 0.2 /100 | #255 | Tragic 5.8% |
| Comanche | 0.2 /100 | #256 | Tragic 5.8% |
| Hispanics or Latinos | 0.1 /100 | #257 | Tragic 5.8% |