Bermudan vs Belgian Male Unemployment
COMPARE
Bermudan
Belgian
Male Unemployment
Male Unemployment Comparison
Bermudans
Belgians
5.9%
MALE UNEMPLOYMENT
0.0/ 100
METRIC RATING
268th/ 347
METRIC RANK
4.8%
MALE UNEMPLOYMENT
99.9/ 100
METRIC RATING
27th/ 347
METRIC RANK
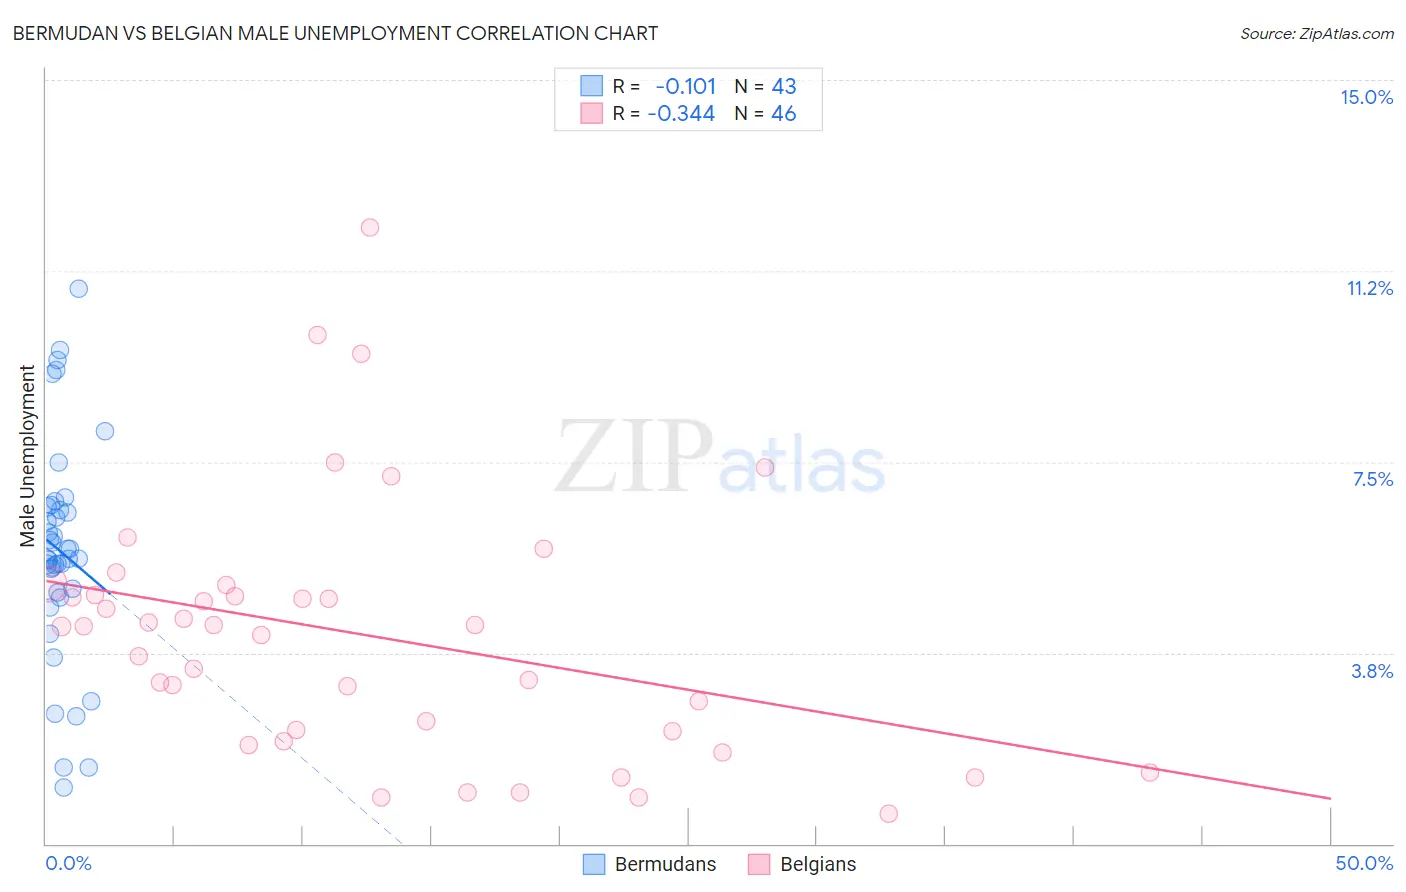
Bermudan vs Belgian Male Unemployment Correlation Chart
The statistical analysis conducted on geographies consisting of 55,661,801 people shows a poor negative correlation between the proportion of Bermudans and unemployment rate among males in the United States with a correlation coefficient (R) of -0.101 and weighted average of 5.9%. Similarly, the statistical analysis conducted on geographies consisting of 354,096,241 people shows a mild negative correlation between the proportion of Belgians and unemployment rate among males in the United States with a correlation coefficient (R) of -0.344 and weighted average of 4.8%, a difference of 24.0%.
Male Unemployment Correlation Summary
| Measurement | Bermudan | Belgian |
| Minimum | 1.1% | 0.60% |
| Maximum | 10.9% | 12.1% |
| Range | 9.8% | 11.5% |
| Mean | 5.7% | 4.1% |
| Median | 5.6% | 4.3% |
| Interquartile 25% (IQ1) | 4.9% | 2.2% |
| Interquartile 75% (IQ3) | 6.6% | 4.9% |
| Interquartile Range (IQR) | 1.7% | 2.7% |
| Standard Deviation (Sample) | 2.1% | 2.5% |
| Standard Deviation (Population) | 2.1% | 2.5% |
Similar Demographics by Male Unemployment
Demographics Similar to Bermudans by Male Unemployment
In terms of male unemployment, the demographic groups most similar to Bermudans are Nigerian (5.9%, a difference of 0.21%), Immigrants from Nigeria (6.0%, a difference of 0.27%), Bahamian (5.9%, a difference of 0.33%), Subsaharan African (6.0%, a difference of 0.40%), and French American Indian (5.9%, a difference of 0.47%).
| Demographics | Rating | Rank | Male Unemployment |
| Liberians | 0.1 /100 | #261 | Tragic 5.8% |
| Immigrants | Portugal | 0.1 /100 | #262 | Tragic 5.9% |
| Immigrants | Latin America | 0.1 /100 | #263 | Tragic 5.9% |
| Immigrants | Mexico | 0.0 /100 | #264 | Tragic 5.9% |
| French American Indians | 0.0 /100 | #265 | Tragic 5.9% |
| Bahamians | 0.0 /100 | #266 | Tragic 5.9% |
| Nigerians | 0.0 /100 | #267 | Tragic 5.9% |
| Bermudans | 0.0 /100 | #268 | Tragic 5.9% |
| Immigrants | Nigeria | 0.0 /100 | #269 | Tragic 6.0% |
| Sub-Saharan Africans | 0.0 /100 | #270 | Tragic 6.0% |
| Blackfeet | 0.0 /100 | #271 | Tragic 6.0% |
| Immigrants | Uzbekistan | 0.0 /100 | #272 | Tragic 6.0% |
| Armenians | 0.0 /100 | #273 | Tragic 6.0% |
| Immigrants | Sierra Leone | 0.0 /100 | #274 | Tragic 6.0% |
| Menominee | 0.0 /100 | #275 | Tragic 6.0% |
Demographics Similar to Belgians by Male Unemployment
In terms of male unemployment, the demographic groups most similar to Belgians are Bulgarian (4.8%, a difference of 0.18%), Dutch (4.8%, a difference of 0.20%), Zimbabwean (4.8%, a difference of 0.22%), Immigrants from South Central Asia (4.8%, a difference of 0.32%), and Scottish (4.8%, a difference of 0.32%).
| Demographics | Rating | Rank | Male Unemployment |
| Pennsylvania Germans | 99.9 /100 | #20 | Exceptional 4.8% |
| Immigrants | Taiwan | 99.9 /100 | #21 | Exceptional 4.8% |
| Carpatho Rusyns | 99.9 /100 | #22 | Exceptional 4.8% |
| Tongans | 99.9 /100 | #23 | Exceptional 4.8% |
| Immigrants | South Central Asia | 99.9 /100 | #24 | Exceptional 4.8% |
| Zimbabweans | 99.9 /100 | #25 | Exceptional 4.8% |
| Dutch | 99.9 /100 | #26 | Exceptional 4.8% |
| Belgians | 99.9 /100 | #27 | Exceptional 4.8% |
| Bulgarians | 99.8 /100 | #28 | Exceptional 4.8% |
| Scottish | 99.8 /100 | #29 | Exceptional 4.8% |
| British | 99.8 /100 | #30 | Exceptional 4.8% |
| Sudanese | 99.8 /100 | #31 | Exceptional 4.8% |
| Immigrants | Nepal | 99.8 /100 | #32 | Exceptional 4.8% |
| Latvians | 99.7 /100 | #33 | Exceptional 4.8% |
| Welsh | 99.7 /100 | #34 | Exceptional 4.8% |