U.S. Virgin Islander vs Immigrants from Brazil Single Mother Households
COMPARE
U.S. Virgin Islander
Immigrants from Brazil
Single Mother Households
Single Mother Households Comparison
U.S. Virgin Islanders
Immigrants from Brazil
8.6%
SINGLE MOTHER HOUSEHOLDS
0.0/ 100
METRIC RATING
332nd/ 347
METRIC RANK
6.1%
SINGLE MOTHER HOUSEHOLDS
78.9/ 100
METRIC RATING
153rd/ 347
METRIC RANK
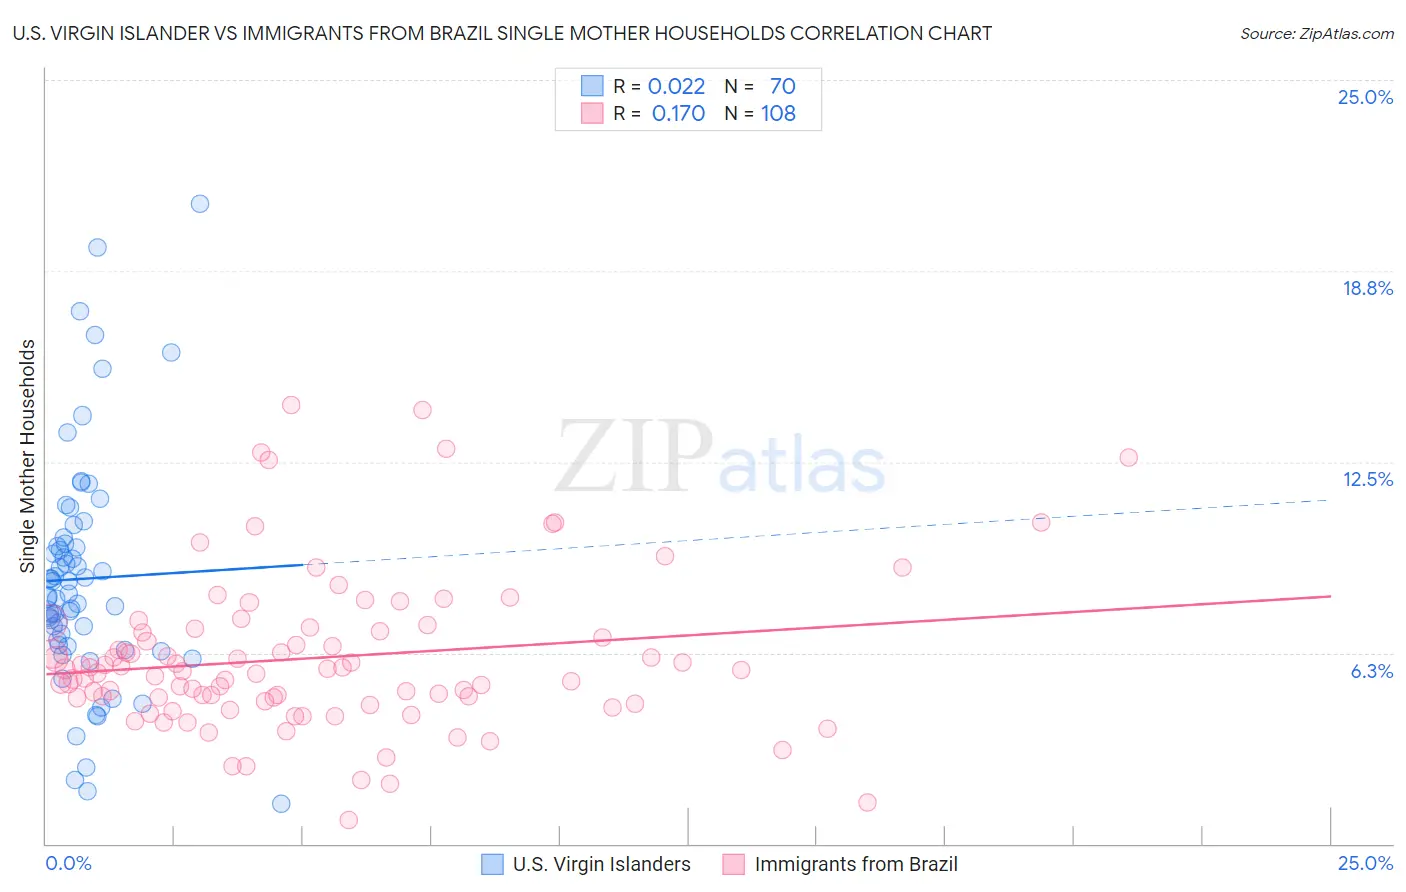
U.S. Virgin Islander vs Immigrants from Brazil Single Mother Households Correlation Chart
The statistical analysis conducted on geographies consisting of 87,484,063 people shows no correlation between the proportion of U.S. Virgin Islanders and percentage of single mother households in the United States with a correlation coefficient (R) of 0.022 and weighted average of 8.6%. Similarly, the statistical analysis conducted on geographies consisting of 342,403,937 people shows a poor positive correlation between the proportion of Immigrants from Brazil and percentage of single mother households in the United States with a correlation coefficient (R) of 0.170 and weighted average of 6.1%, a difference of 41.6%.
Single Mother Households Correlation Summary
| Measurement | U.S. Virgin Islander | Immigrants from Brazil |
| Minimum | 1.3% | 0.79% |
| Maximum | 21.0% | 14.4% |
| Range | 19.7% | 13.6% |
| Mean | 8.7% | 6.1% |
| Median | 8.1% | 5.7% |
| Interquartile 25% (IQ1) | 6.5% | 4.7% |
| Interquartile 75% (IQ3) | 9.8% | 7.0% |
| Interquartile Range (IQR) | 3.3% | 2.2% |
| Standard Deviation (Sample) | 3.8% | 2.6% |
| Standard Deviation (Population) | 3.8% | 2.6% |
Similar Demographics by Single Mother Households
Demographics Similar to U.S. Virgin Islanders by Single Mother Households
In terms of single mother households, the demographic groups most similar to U.S. Virgin Islanders are Liberian (8.6%, a difference of 0.33%), Immigrants from Liberia (8.7%, a difference of 1.1%), Immigrants from Dominica (8.7%, a difference of 1.4%), Puerto Rican (8.7%, a difference of 1.5%), and Inupiat (8.5%, a difference of 1.5%).
| Demographics | Rating | Rank | Single Mother Households |
| Immigrants | Caribbean | 0.0 /100 | #325 | Tragic 8.4% |
| British West Indians | 0.0 /100 | #326 | Tragic 8.4% |
| Immigrants | Haiti | 0.0 /100 | #327 | Tragic 8.4% |
| Yakama | 0.0 /100 | #328 | Tragic 8.4% |
| Hopi | 0.0 /100 | #329 | Tragic 8.5% |
| Inupiat | 0.0 /100 | #330 | Tragic 8.5% |
| Sioux | 0.0 /100 | #331 | Tragic 8.5% |
| U.S. Virgin Islanders | 0.0 /100 | #332 | Tragic 8.6% |
| Liberians | 0.0 /100 | #333 | Tragic 8.6% |
| Immigrants | Liberia | 0.0 /100 | #334 | Tragic 8.7% |
| Immigrants | Dominica | 0.0 /100 | #335 | Tragic 8.7% |
| Puerto Ricans | 0.0 /100 | #336 | Tragic 8.7% |
| Navajo | 0.0 /100 | #337 | Tragic 8.8% |
| Cape Verdeans | 0.0 /100 | #338 | Tragic 8.9% |
| Blacks/African Americans | 0.0 /100 | #339 | Tragic 9.0% |
Demographics Similar to Immigrants from Brazil by Single Mother Households
In terms of single mother households, the demographic groups most similar to Immigrants from Brazil are Pakistani (6.1%, a difference of 0.040%), Immigrants from Philippines (6.1%, a difference of 0.070%), Immigrants from Southern Europe (6.1%, a difference of 0.27%), Zimbabwean (6.1%, a difference of 0.32%), and White/Caucasian (6.1%, a difference of 0.40%).
| Demographics | Rating | Rank | Single Mother Households |
| French Canadians | 82.6 /100 | #146 | Excellent 6.0% |
| Immigrants | Jordan | 82.3 /100 | #147 | Excellent 6.0% |
| Scotch-Irish | 82.0 /100 | #148 | Excellent 6.0% |
| Immigrants | Albania | 81.5 /100 | #149 | Excellent 6.1% |
| Zimbabweans | 80.7 /100 | #150 | Excellent 6.1% |
| Immigrants | Southern Europe | 80.5 /100 | #151 | Excellent 6.1% |
| Pakistanis | 79.2 /100 | #152 | Good 6.1% |
| Immigrants | Brazil | 78.9 /100 | #153 | Good 6.1% |
| Immigrants | Philippines | 78.5 /100 | #154 | Good 6.1% |
| Whites/Caucasians | 76.5 /100 | #155 | Good 6.1% |
| Native Hawaiians | 75.0 /100 | #156 | Good 6.1% |
| Chileans | 74.2 /100 | #157 | Good 6.1% |
| Celtics | 73.3 /100 | #158 | Good 6.1% |
| Yugoslavians | 73.1 /100 | #159 | Good 6.1% |
| Iraqis | 73.0 /100 | #160 | Good 6.1% |