U.S. Virgin Islander vs Immigrants from Switzerland Female Unemployment
COMPARE
U.S. Virgin Islander
Immigrants from Switzerland
Female Unemployment
Female Unemployment Comparison
U.S. Virgin Islanders
Immigrants from Switzerland
6.2%
FEMALE UNEMPLOYMENT
0.0/ 100
METRIC RATING
302nd/ 347
METRIC RANK
5.1%
FEMALE UNEMPLOYMENT
93.1/ 100
METRIC RATING
107th/ 347
METRIC RANK
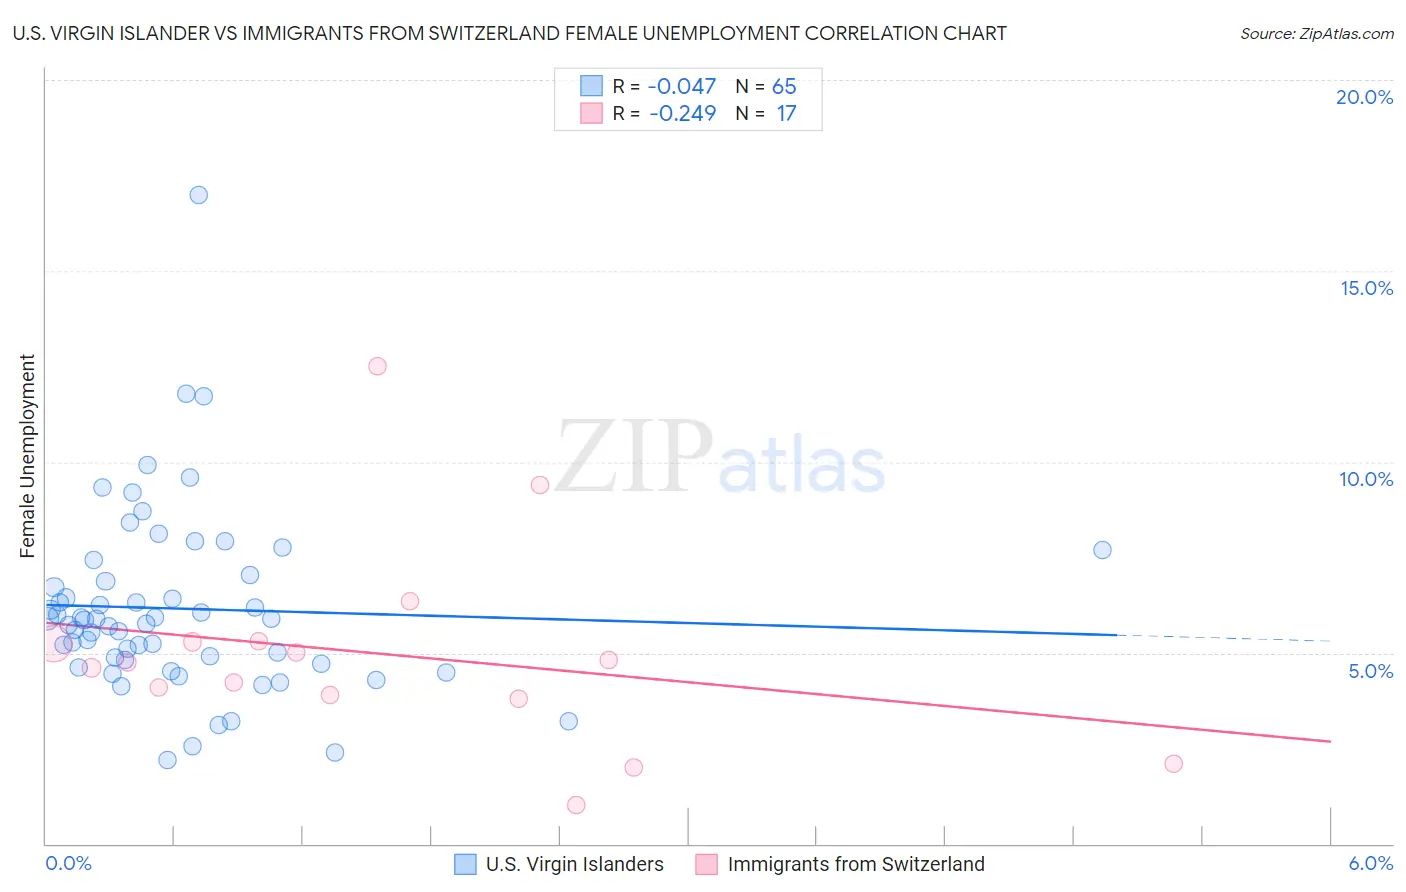
U.S. Virgin Islander vs Immigrants from Switzerland Female Unemployment Correlation Chart
The statistical analysis conducted on geographies consisting of 87,490,240 people shows no correlation between the proportion of U.S. Virgin Islanders and unemploymnet rate among females in the United States with a correlation coefficient (R) of -0.047 and weighted average of 6.2%. Similarly, the statistical analysis conducted on geographies consisting of 147,831,488 people shows a weak negative correlation between the proportion of Immigrants from Switzerland and unemploymnet rate among females in the United States with a correlation coefficient (R) of -0.249 and weighted average of 5.1%, a difference of 22.1%.
Female Unemployment Correlation Summary
| Measurement | U.S. Virgin Islander | Immigrants from Switzerland |
| Minimum | 2.2% | 1.0% |
| Maximum | 17.0% | 12.5% |
| Range | 14.8% | 11.5% |
| Mean | 6.2% | 5.0% |
| Median | 5.9% | 4.7% |
| Interquartile 25% (IQ1) | 4.8% | 3.8% |
| Interquartile 75% (IQ3) | 7.0% | 5.3% |
| Interquartile Range (IQR) | 2.2% | 1.4% |
| Standard Deviation (Sample) | 2.4% | 2.7% |
| Standard Deviation (Population) | 2.4% | 2.6% |
Similar Demographics by Female Unemployment
Demographics Similar to U.S. Virgin Islanders by Female Unemployment
In terms of female unemployment, the demographic groups most similar to U.S. Virgin Islanders are Immigrants from Barbados (6.2%, a difference of 0.15%), Barbadian (6.2%, a difference of 0.34%), Immigrants from Haiti (6.1%, a difference of 0.60%), Ute (6.1%, a difference of 0.65%), and Immigrants from Jamaica (6.2%, a difference of 0.71%).
| Demographics | Rating | Rank | Female Unemployment |
| Immigrants | Latin America | 0.0 /100 | #295 | Tragic 6.1% |
| Alaskan Athabascans | 0.0 /100 | #296 | Tragic 6.1% |
| West Indians | 0.0 /100 | #297 | Tragic 6.1% |
| Jamaicans | 0.0 /100 | #298 | Tragic 6.1% |
| Ute | 0.0 /100 | #299 | Tragic 6.1% |
| Immigrants | Haiti | 0.0 /100 | #300 | Tragic 6.1% |
| Immigrants | Barbados | 0.0 /100 | #301 | Tragic 6.2% |
| U.S. Virgin Islanders | 0.0 /100 | #302 | Tragic 6.2% |
| Barbadians | 0.0 /100 | #303 | Tragic 6.2% |
| Immigrants | Jamaica | 0.0 /100 | #304 | Tragic 6.2% |
| Spanish American Indians | 0.0 /100 | #305 | Tragic 6.2% |
| Immigrants | Central America | 0.0 /100 | #306 | Tragic 6.2% |
| Shoshone | 0.0 /100 | #307 | Tragic 6.2% |
| Hispanics or Latinos | 0.0 /100 | #308 | Tragic 6.2% |
| Ecuadorians | 0.0 /100 | #309 | Tragic 6.3% |
Demographics Similar to Immigrants from Switzerland by Female Unemployment
In terms of female unemployment, the demographic groups most similar to Immigrants from Switzerland are Puget Sound Salish (5.1%, a difference of 0.020%), Paraguayan (5.1%, a difference of 0.030%), Immigrants from Eastern Africa (5.1%, a difference of 0.060%), Immigrants from England (5.0%, a difference of 0.12%), and Kenyan (5.0%, a difference of 0.15%).
| Demographics | Rating | Rank | Female Unemployment |
| Indonesians | 95.1 /100 | #100 | Exceptional 5.0% |
| Immigrants | Czechoslovakia | 95.0 /100 | #101 | Exceptional 5.0% |
| Immigrants | Kenya | 94.8 /100 | #102 | Exceptional 5.0% |
| Somalis | 94.6 /100 | #103 | Exceptional 5.0% |
| Kenyans | 93.7 /100 | #104 | Exceptional 5.0% |
| Immigrants | England | 93.6 /100 | #105 | Exceptional 5.0% |
| Paraguayans | 93.2 /100 | #106 | Exceptional 5.1% |
| Immigrants | Switzerland | 93.1 /100 | #107 | Exceptional 5.1% |
| Puget Sound Salish | 93.0 /100 | #108 | Exceptional 5.1% |
| Immigrants | Eastern Africa | 92.8 /100 | #109 | Exceptional 5.1% |
| Macedonians | 92.4 /100 | #110 | Exceptional 5.1% |
| Immigrants | Burma/Myanmar | 92.3 /100 | #111 | Exceptional 5.1% |
| Estonians | 92.1 /100 | #112 | Exceptional 5.1% |
| Immigrants | Saudi Arabia | 91.2 /100 | #113 | Exceptional 5.1% |
| Immigrants | Turkey | 91.0 /100 | #114 | Exceptional 5.1% |