Uruguayan vs Immigrants from Argentina Female Unemployment
COMPARE
Uruguayan
Immigrants from Argentina
Female Unemployment
Female Unemployment Comparison
Uruguayans
Immigrants from Argentina
5.4%
FEMALE UNEMPLOYMENT
11.4/ 100
METRIC RATING
212th/ 347
METRIC RANK
5.2%
FEMALE UNEMPLOYMENT
78.7/ 100
METRIC RATING
148th/ 347
METRIC RANK
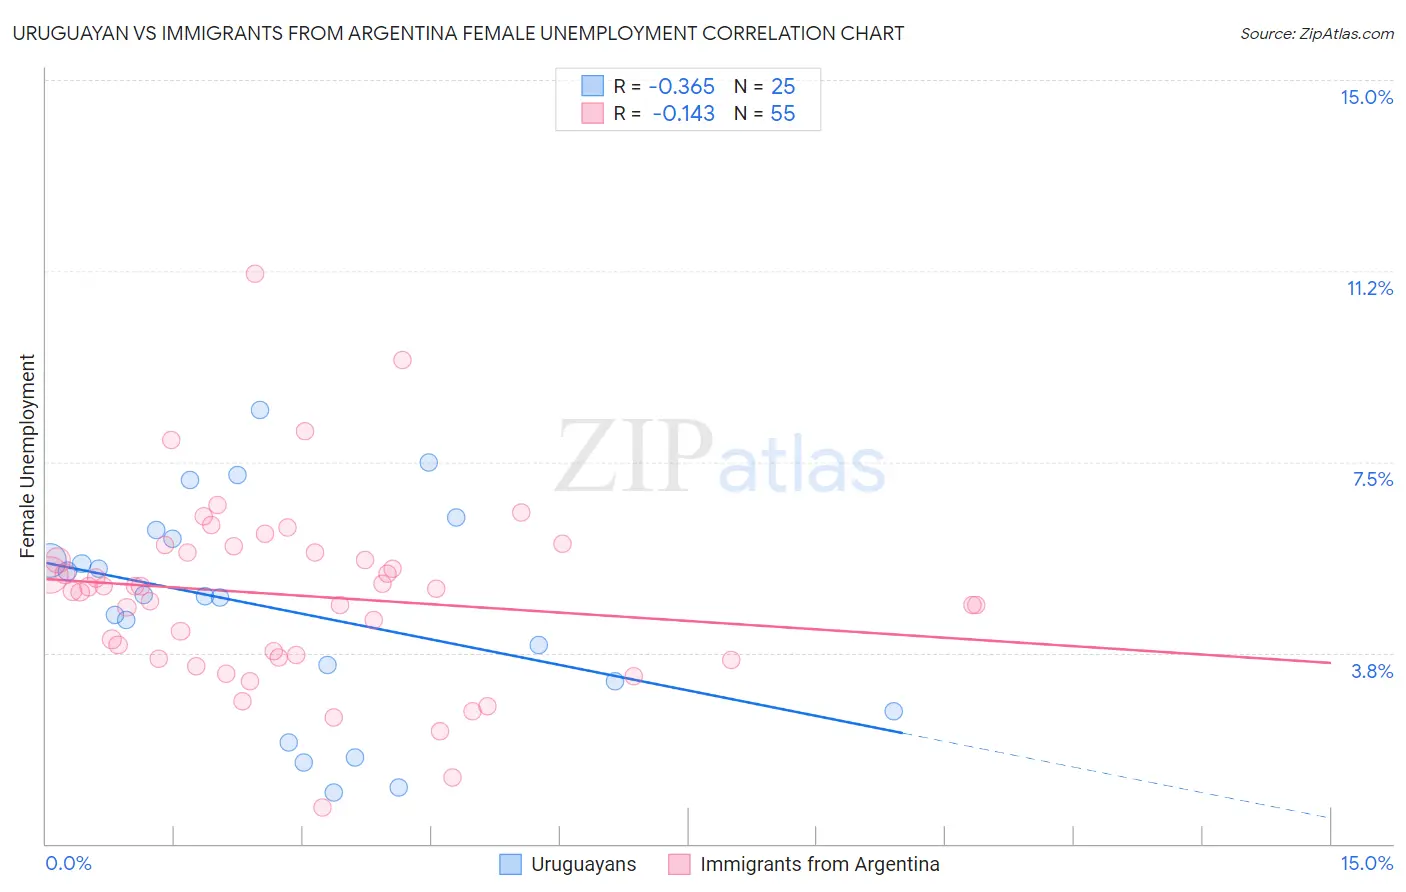
Uruguayan vs Immigrants from Argentina Female Unemployment Correlation Chart
The statistical analysis conducted on geographies consisting of 144,657,332 people shows a mild negative correlation between the proportion of Uruguayans and unemploymnet rate among females in the United States with a correlation coefficient (R) of -0.365 and weighted average of 5.4%. Similarly, the statistical analysis conducted on geographies consisting of 263,999,591 people shows a poor negative correlation between the proportion of Immigrants from Argentina and unemploymnet rate among females in the United States with a correlation coefficient (R) of -0.143 and weighted average of 5.2%, a difference of 5.1%.
Female Unemployment Correlation Summary
| Measurement | Uruguayan | Immigrants from Argentina |
| Minimum | 1.0% | 0.70% |
| Maximum | 8.5% | 11.2% |
| Range | 7.5% | 10.5% |
| Mean | 4.6% | 4.9% |
| Median | 4.9% | 5.0% |
| Interquartile 25% (IQ1) | 2.9% | 3.7% |
| Interquartile 75% (IQ3) | 6.1% | 5.7% |
| Interquartile Range (IQR) | 3.2% | 2.1% |
| Standard Deviation (Sample) | 2.1% | 1.8% |
| Standard Deviation (Population) | 2.0% | 1.8% |
Similar Demographics by Female Unemployment
Demographics Similar to Uruguayans by Female Unemployment
In terms of female unemployment, the demographic groups most similar to Uruguayans are Ottawa (5.4%, a difference of 0.020%), Choctaw (5.4%, a difference of 0.12%), Samoan (5.4%, a difference of 0.12%), Seminole (5.4%, a difference of 0.17%), and Immigrants from Nicaragua (5.4%, a difference of 0.19%).
| Demographics | Rating | Rank | Female Unemployment |
| Immigrants | Afghanistan | 18.9 /100 | #205 | Poor 5.4% |
| Immigrants | Brazil | 18.8 /100 | #206 | Poor 5.4% |
| Creek | 15.4 /100 | #207 | Poor 5.4% |
| Immigrants | Costa Rica | 13.7 /100 | #208 | Poor 5.4% |
| Koreans | 13.4 /100 | #209 | Poor 5.4% |
| Choctaw | 12.3 /100 | #210 | Poor 5.4% |
| Ottawa | 11.6 /100 | #211 | Poor 5.4% |
| Uruguayans | 11.4 /100 | #212 | Poor 5.4% |
| Samoans | 10.6 /100 | #213 | Poor 5.4% |
| Seminole | 10.3 /100 | #214 | Poor 5.4% |
| Immigrants | Nicaragua | 10.2 /100 | #215 | Poor 5.4% |
| Comanche | 10.0 /100 | #216 | Poor 5.4% |
| Peruvians | 9.6 /100 | #217 | Tragic 5.4% |
| Bermudans | 9.0 /100 | #218 | Tragic 5.4% |
| South Americans | 8.6 /100 | #219 | Tragic 5.4% |
Demographics Similar to Immigrants from Argentina by Female Unemployment
In terms of female unemployment, the demographic groups most similar to Immigrants from Argentina are Asian (5.2%, a difference of 0.030%), Egyptian (5.2%, a difference of 0.040%), Argentinean (5.2%, a difference of 0.050%), Immigrants from Norway (5.2%, a difference of 0.060%), and Immigrants from Oceania (5.2%, a difference of 0.070%).
| Demographics | Rating | Rank | Female Unemployment |
| Immigrants | Eastern Europe | 81.5 /100 | #141 | Excellent 5.1% |
| Palestinians | 80.8 /100 | #142 | Excellent 5.1% |
| Immigrants | Kazakhstan | 80.7 /100 | #143 | Excellent 5.1% |
| Immigrants | Jordan | 80.4 /100 | #144 | Excellent 5.1% |
| Immigrants | Oceania | 79.5 /100 | #145 | Good 5.2% |
| Immigrants | Norway | 79.4 /100 | #146 | Good 5.2% |
| Argentineans | 79.2 /100 | #147 | Good 5.2% |
| Immigrants | Argentina | 78.7 /100 | #148 | Good 5.2% |
| Asians | 78.3 /100 | #149 | Good 5.2% |
| Egyptians | 78.3 /100 | #150 | Good 5.2% |
| Immigrants | China | 75.9 /100 | #151 | Good 5.2% |
| Immigrants | Italy | 75.0 /100 | #152 | Good 5.2% |
| Immigrants | Greece | 74.9 /100 | #153 | Good 5.2% |
| South Africans | 70.8 /100 | #154 | Good 5.2% |
| Immigrants | Egypt | 70.0 /100 | #155 | Good 5.2% |