Haitian vs Immigrants from Argentina Female Unemployment
COMPARE
Haitian
Immigrants from Argentina
Female Unemployment
Female Unemployment Comparison
Haitians
Immigrants from Argentina
6.1%
FEMALE UNEMPLOYMENT
0.0/ 100
METRIC RATING
288th/ 347
METRIC RANK
5.2%
FEMALE UNEMPLOYMENT
78.7/ 100
METRIC RATING
148th/ 347
METRIC RANK
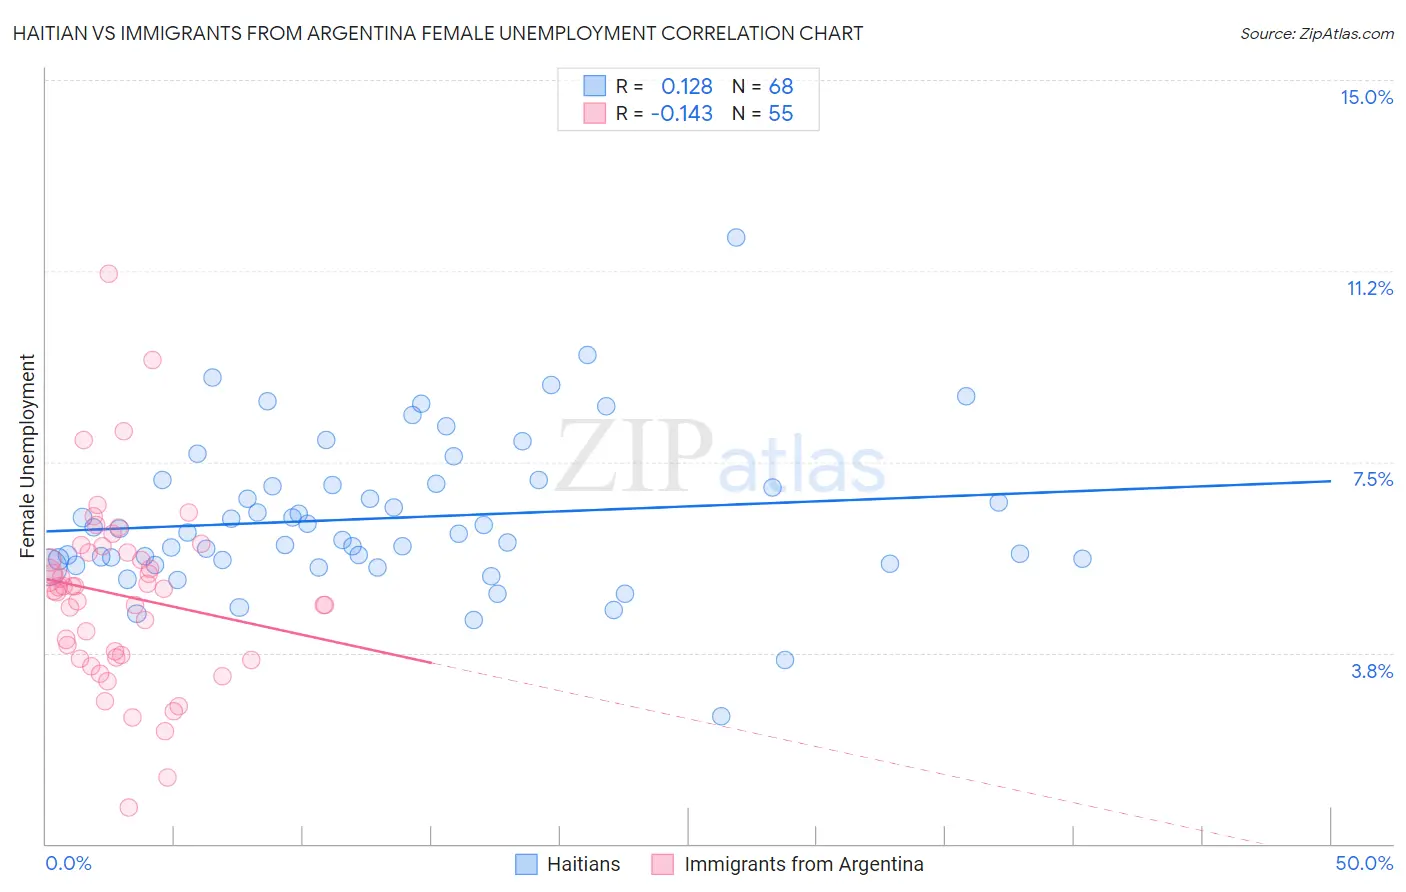
Haitian vs Immigrants from Argentina Female Unemployment Correlation Chart
The statistical analysis conducted on geographies consisting of 287,205,640 people shows a poor positive correlation between the proportion of Haitians and unemploymnet rate among females in the United States with a correlation coefficient (R) of 0.128 and weighted average of 6.1%. Similarly, the statistical analysis conducted on geographies consisting of 263,999,591 people shows a poor negative correlation between the proportion of Immigrants from Argentina and unemploymnet rate among females in the United States with a correlation coefficient (R) of -0.143 and weighted average of 5.2%, a difference of 18.1%.
Female Unemployment Correlation Summary
| Measurement | Haitian | Immigrants from Argentina |
| Minimum | 2.5% | 0.70% |
| Maximum | 11.9% | 11.2% |
| Range | 9.4% | 10.5% |
| Mean | 6.4% | 4.9% |
| Median | 6.1% | 5.0% |
| Interquartile 25% (IQ1) | 5.5% | 3.7% |
| Interquartile 75% (IQ3) | 7.1% | 5.7% |
| Interquartile Range (IQR) | 1.5% | 2.1% |
| Standard Deviation (Sample) | 1.5% | 1.8% |
| Standard Deviation (Population) | 1.5% | 1.8% |
Similar Demographics by Female Unemployment
Demographics Similar to Haitians by Female Unemployment
In terms of female unemployment, the demographic groups most similar to Haitians are Trinidadian and Tobagonian (6.1%, a difference of 0.010%), Immigrants from Guatemala (6.1%, a difference of 0.040%), Chippewa (6.1%, a difference of 0.070%), Immigrants from Caribbean (6.1%, a difference of 0.070%), and Immigrants from Cabo Verde (6.1%, a difference of 0.10%).
| Demographics | Rating | Rank | Female Unemployment |
| Guatemalans | 0.0 /100 | #281 | Tragic 6.0% |
| Colville | 0.0 /100 | #282 | Tragic 6.0% |
| Salvadorans | 0.0 /100 | #283 | Tragic 6.0% |
| Immigrants | Senegal | 0.0 /100 | #284 | Tragic 6.1% |
| Immigrants | Cabo Verde | 0.0 /100 | #285 | Tragic 6.1% |
| Chippewa | 0.0 /100 | #286 | Tragic 6.1% |
| Immigrants | Guatemala | 0.0 /100 | #287 | Tragic 6.1% |
| Haitians | 0.0 /100 | #288 | Tragic 6.1% |
| Trinidadians and Tobagonians | 0.0 /100 | #289 | Tragic 6.1% |
| Immigrants | Caribbean | 0.0 /100 | #290 | Tragic 6.1% |
| Immigrants | West Indies | 0.0 /100 | #291 | Tragic 6.1% |
| Immigrants | Trinidad and Tobago | 0.0 /100 | #292 | Tragic 6.1% |
| Mexicans | 0.0 /100 | #293 | Tragic 6.1% |
| Immigrants | El Salvador | 0.0 /100 | #294 | Tragic 6.1% |
| Immigrants | Latin America | 0.0 /100 | #295 | Tragic 6.1% |
Demographics Similar to Immigrants from Argentina by Female Unemployment
In terms of female unemployment, the demographic groups most similar to Immigrants from Argentina are Asian (5.2%, a difference of 0.030%), Egyptian (5.2%, a difference of 0.040%), Argentinean (5.2%, a difference of 0.050%), Immigrants from Norway (5.2%, a difference of 0.060%), and Immigrants from Oceania (5.2%, a difference of 0.070%).
| Demographics | Rating | Rank | Female Unemployment |
| Immigrants | Eastern Europe | 81.5 /100 | #141 | Excellent 5.1% |
| Palestinians | 80.8 /100 | #142 | Excellent 5.1% |
| Immigrants | Kazakhstan | 80.7 /100 | #143 | Excellent 5.1% |
| Immigrants | Jordan | 80.4 /100 | #144 | Excellent 5.1% |
| Immigrants | Oceania | 79.5 /100 | #145 | Good 5.2% |
| Immigrants | Norway | 79.4 /100 | #146 | Good 5.2% |
| Argentineans | 79.2 /100 | #147 | Good 5.2% |
| Immigrants | Argentina | 78.7 /100 | #148 | Good 5.2% |
| Asians | 78.3 /100 | #149 | Good 5.2% |
| Egyptians | 78.3 /100 | #150 | Good 5.2% |
| Immigrants | China | 75.9 /100 | #151 | Good 5.2% |
| Immigrants | Italy | 75.0 /100 | #152 | Good 5.2% |
| Immigrants | Greece | 74.9 /100 | #153 | Good 5.2% |
| South Africans | 70.8 /100 | #154 | Good 5.2% |
| Immigrants | Egypt | 70.0 /100 | #155 | Good 5.2% |