Uruguayan vs Immigrants from Cuba Female Unemployment
COMPARE
Uruguayan
Immigrants from Cuba
Female Unemployment
Female Unemployment Comparison
Uruguayans
Immigrants from Cuba
5.4%
FEMALE UNEMPLOYMENT
11.4/ 100
METRIC RATING
212th/ 347
METRIC RANK
4.9%
FEMALE UNEMPLOYMENT
99.1/ 100
METRIC RATING
50th/ 347
METRIC RANK
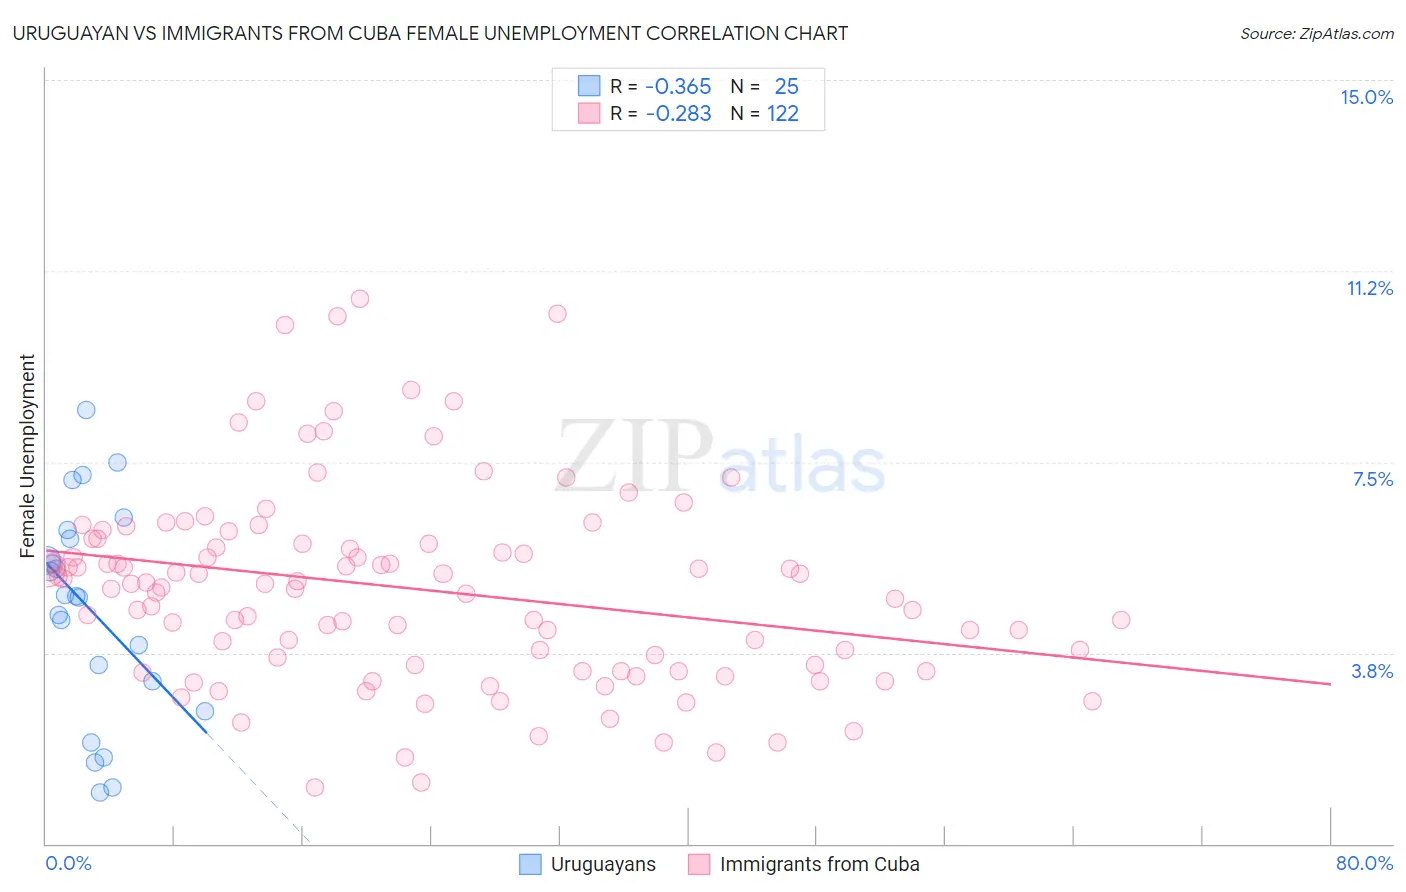
Uruguayan vs Immigrants from Cuba Female Unemployment Correlation Chart
The statistical analysis conducted on geographies consisting of 144,657,332 people shows a mild negative correlation between the proportion of Uruguayans and unemploymnet rate among females in the United States with a correlation coefficient (R) of -0.365 and weighted average of 5.4%. Similarly, the statistical analysis conducted on geographies consisting of 325,054,081 people shows a weak negative correlation between the proportion of Immigrants from Cuba and unemploymnet rate among females in the United States with a correlation coefficient (R) of -0.283 and weighted average of 4.9%, a difference of 10.9%.
Female Unemployment Correlation Summary
| Measurement | Uruguayan | Immigrants from Cuba |
| Minimum | 1.0% | 1.1% |
| Maximum | 8.5% | 10.7% |
| Range | 7.5% | 9.6% |
| Mean | 4.6% | 5.0% |
| Median | 4.9% | 5.1% |
| Interquartile 25% (IQ1) | 2.9% | 3.5% |
| Interquartile 75% (IQ3) | 6.1% | 5.9% |
| Interquartile Range (IQR) | 3.2% | 2.4% |
| Standard Deviation (Sample) | 2.1% | 1.9% |
| Standard Deviation (Population) | 2.0% | 1.9% |
Similar Demographics by Female Unemployment
Demographics Similar to Uruguayans by Female Unemployment
In terms of female unemployment, the demographic groups most similar to Uruguayans are Ottawa (5.4%, a difference of 0.020%), Choctaw (5.4%, a difference of 0.12%), Samoan (5.4%, a difference of 0.12%), Seminole (5.4%, a difference of 0.17%), and Immigrants from Nicaragua (5.4%, a difference of 0.19%).
| Demographics | Rating | Rank | Female Unemployment |
| Immigrants | Afghanistan | 18.9 /100 | #205 | Poor 5.4% |
| Immigrants | Brazil | 18.8 /100 | #206 | Poor 5.4% |
| Creek | 15.4 /100 | #207 | Poor 5.4% |
| Immigrants | Costa Rica | 13.7 /100 | #208 | Poor 5.4% |
| Koreans | 13.4 /100 | #209 | Poor 5.4% |
| Choctaw | 12.3 /100 | #210 | Poor 5.4% |
| Ottawa | 11.6 /100 | #211 | Poor 5.4% |
| Uruguayans | 11.4 /100 | #212 | Poor 5.4% |
| Samoans | 10.6 /100 | #213 | Poor 5.4% |
| Seminole | 10.3 /100 | #214 | Poor 5.4% |
| Immigrants | Nicaragua | 10.2 /100 | #215 | Poor 5.4% |
| Comanche | 10.0 /100 | #216 | Poor 5.4% |
| Peruvians | 9.6 /100 | #217 | Tragic 5.4% |
| Bermudans | 9.0 /100 | #218 | Tragic 5.4% |
| South Americans | 8.6 /100 | #219 | Tragic 5.4% |
Demographics Similar to Immigrants from Cuba by Female Unemployment
In terms of female unemployment, the demographic groups most similar to Immigrants from Cuba are Cambodian (4.9%, a difference of 0.020%), Slavic (4.9%, a difference of 0.040%), White/Caucasian (4.9%, a difference of 0.070%), Immigrants from Zimbabwe (4.9%, a difference of 0.13%), and Immigrants from Moldova (4.9%, a difference of 0.14%).
| Demographics | Rating | Rank | Female Unemployment |
| Eastern Europeans | 99.4 /100 | #43 | Exceptional 4.9% |
| Greeks | 99.4 /100 | #44 | Exceptional 4.9% |
| Austrians | 99.3 /100 | #45 | Exceptional 4.9% |
| Immigrants | Bulgaria | 99.3 /100 | #46 | Exceptional 4.9% |
| Okinawans | 99.3 /100 | #47 | Exceptional 4.9% |
| Thais | 99.2 /100 | #48 | Exceptional 4.9% |
| Australians | 99.2 /100 | #49 | Exceptional 4.9% |
| Immigrants | Cuba | 99.1 /100 | #50 | Exceptional 4.9% |
| Cambodians | 99.1 /100 | #51 | Exceptional 4.9% |
| Slavs | 99.1 /100 | #52 | Exceptional 4.9% |
| Whites/Caucasians | 99.0 /100 | #53 | Exceptional 4.9% |
| Immigrants | Zimbabwe | 99.0 /100 | #54 | Exceptional 4.9% |
| Immigrants | Moldova | 99.0 /100 | #55 | Exceptional 4.9% |
| Serbians | 99.0 /100 | #56 | Exceptional 4.9% |
| Icelanders | 98.8 /100 | #57 | Exceptional 4.9% |