Uruguayan vs Immigrants from Argentina Male Poverty
COMPARE
Uruguayan
Immigrants from Argentina
Male Poverty
Male Poverty Comparison
Uruguayans
Immigrants from Argentina
11.2%
MALE POVERTY
51.0/ 100
METRIC RATING
171st/ 347
METRIC RANK
10.6%
MALE POVERTY
89.8/ 100
METRIC RATING
111th/ 347
METRIC RANK
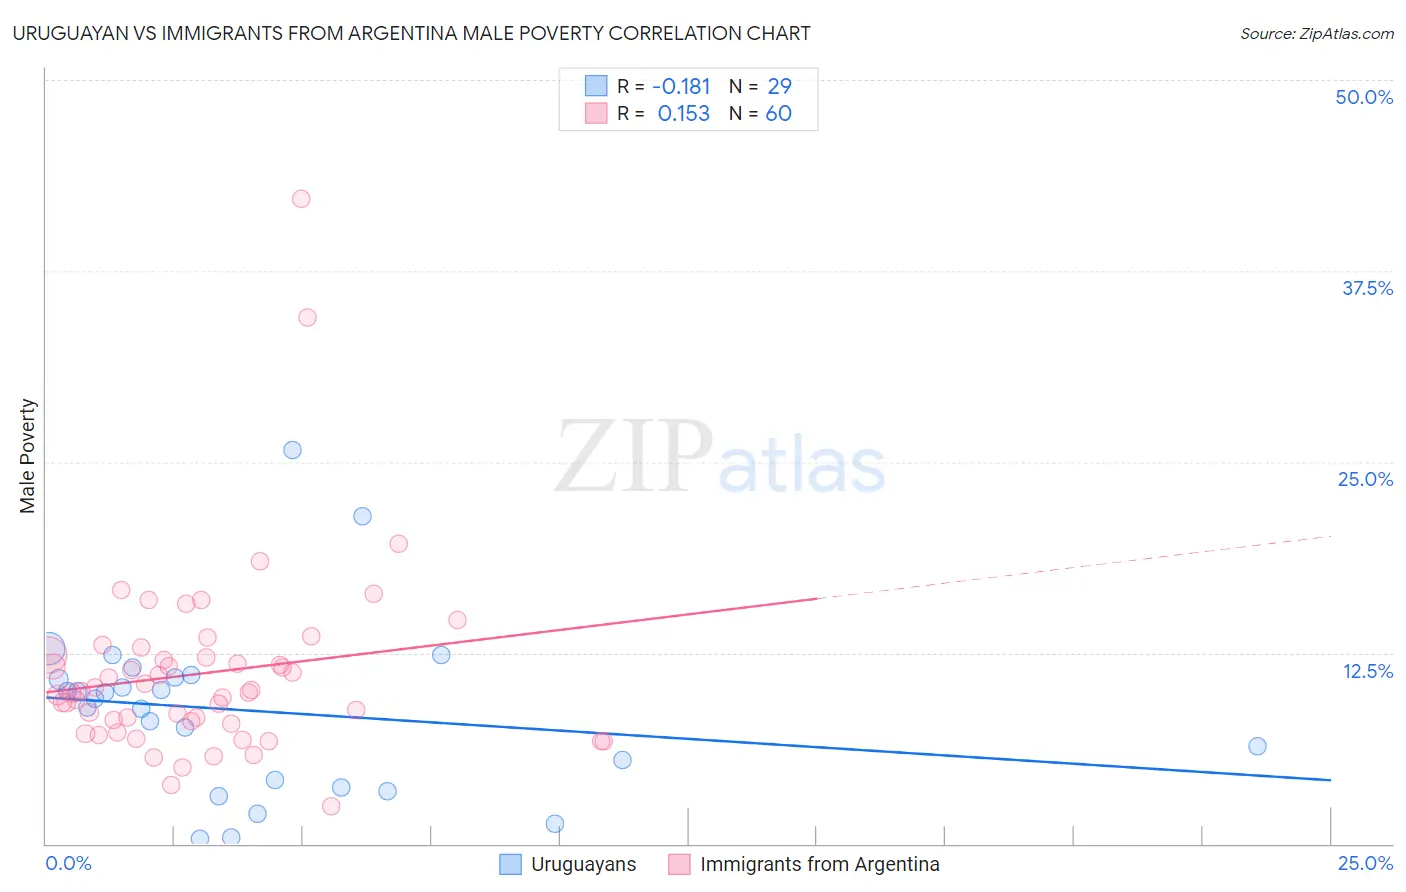
Uruguayan vs Immigrants from Argentina Male Poverty Correlation Chart
The statistical analysis conducted on geographies consisting of 144,748,239 people shows a poor negative correlation between the proportion of Uruguayans and poverty level among males in the United States with a correlation coefficient (R) of -0.181 and weighted average of 11.2%. Similarly, the statistical analysis conducted on geographies consisting of 264,308,619 people shows a poor positive correlation between the proportion of Immigrants from Argentina and poverty level among males in the United States with a correlation coefficient (R) of 0.153 and weighted average of 10.6%, a difference of 5.5%.
Male Poverty Correlation Summary
| Measurement | Uruguayan | Immigrants from Argentina |
| Minimum | 0.34% | 2.5% |
| Maximum | 25.8% | 42.3% |
| Range | 25.4% | 39.8% |
| Mean | 8.7% | 11.2% |
| Median | 9.5% | 9.9% |
| Interquartile 25% (IQ1) | 3.9% | 7.9% |
| Interquartile 75% (IQ3) | 11.0% | 12.3% |
| Interquartile Range (IQR) | 7.0% | 4.4% |
| Standard Deviation (Sample) | 5.6% | 6.2% |
| Standard Deviation (Population) | 5.5% | 6.2% |
Similar Demographics by Male Poverty
Demographics Similar to Uruguayans by Male Poverty
In terms of male poverty, the demographic groups most similar to Uruguayans are Immigrants from Ethiopia (11.2%, a difference of 0.040%), Pennsylvania German (11.2%, a difference of 0.060%), Immigrants from Oceania (11.2%, a difference of 0.10%), South American (11.1%, a difference of 0.27%), and Immigrants from Colombia (11.1%, a difference of 0.31%).
| Demographics | Rating | Rank | Male Poverty |
| Ethiopians | 56.7 /100 | #164 | Average 11.1% |
| Immigrants | Spain | 55.5 /100 | #165 | Average 11.1% |
| Immigrants | Albania | 55.3 /100 | #166 | Average 11.1% |
| Hungarians | 55.1 /100 | #167 | Average 11.1% |
| Immigrants | Portugal | 54.9 /100 | #168 | Average 11.1% |
| Immigrants | Colombia | 54.2 /100 | #169 | Average 11.1% |
| South Americans | 53.8 /100 | #170 | Average 11.1% |
| Uruguayans | 51.0 /100 | #171 | Average 11.2% |
| Immigrants | Ethiopia | 50.7 /100 | #172 | Average 11.2% |
| Pennsylvania Germans | 50.5 /100 | #173 | Average 11.2% |
| Immigrants | Oceania | 50.0 /100 | #174 | Average 11.2% |
| Celtics | 47.5 /100 | #175 | Average 11.2% |
| Immigrants | Fiji | 46.0 /100 | #176 | Average 11.2% |
| Lebanese | 45.6 /100 | #177 | Average 11.2% |
| Immigrants | Cameroon | 44.5 /100 | #178 | Average 11.2% |
Demographics Similar to Immigrants from Argentina by Male Poverty
In terms of male poverty, the demographic groups most similar to Immigrants from Argentina are Immigrants from Turkey (10.6%, a difference of 0.080%), Argentinean (10.6%, a difference of 0.11%), Palestinian (10.6%, a difference of 0.18%), Immigrants from Brazil (10.6%, a difference of 0.20%), and Albanian (10.6%, a difference of 0.24%).
| Demographics | Rating | Rank | Male Poverty |
| Welsh | 91.6 /100 | #104 | Exceptional 10.5% |
| Canadians | 91.6 /100 | #105 | Exceptional 10.5% |
| Immigrants | Southern Europe | 91.3 /100 | #106 | Exceptional 10.5% |
| Laotians | 91.2 /100 | #107 | Exceptional 10.5% |
| Portuguese | 91.0 /100 | #108 | Exceptional 10.6% |
| Albanians | 90.6 /100 | #109 | Exceptional 10.6% |
| Argentineans | 90.1 /100 | #110 | Exceptional 10.6% |
| Immigrants | Argentina | 89.8 /100 | #111 | Excellent 10.6% |
| Immigrants | Turkey | 89.5 /100 | #112 | Excellent 10.6% |
| Palestinians | 89.1 /100 | #113 | Excellent 10.6% |
| Immigrants | Brazil | 89.0 /100 | #114 | Excellent 10.6% |
| Immigrants | Russia | 88.6 /100 | #115 | Excellent 10.6% |
| Sri Lankans | 88.1 /100 | #116 | Excellent 10.6% |
| Immigrants | South Eastern Asia | 88.1 /100 | #117 | Excellent 10.6% |
| Okinawans | 87.6 /100 | #118 | Excellent 10.7% |