Uruguayan vs Ethiopian Female Unemployment

COMPARE

Uruguayan
Race
Ancestry
AfghanAfricanAlaska NativeAlaskan AthabascanAlbanianAleutAlsatianAmericanApacheArabArapahoArgentineanArmenianAssyrian/Chaldean/SyriacAustralianAustrianBahamianBangladeshiBarbadianBasqueBelgianBelizeanBermudanBhutaneseBlackfeetBolivianBrazilianBritishBritish West IndianBulgarianBurmeseCajunCambodianCanadianCape VerdeanCarpatho RusynCelticCentral AmericanCentral American IndianCherokeeCheyenneChickasawChileanChineseChippewaChoctawColombianColvilleComancheCosta RicanCreeCreekCroatianCrowCubanCypriotCzechCzechoslovakianDanishDelawareDominicanDutchDutch West IndianEastern EuropeanEcuadorianEgyptianEnglishEstonianEuropeanFijianFilipinoFinnishFrenchFrench American IndianFrench CanadianGermanGerman RussianGhanaianGreekGuamanian/ChamorroGuatemalanGuyaneseHaitianHmongHonduranHopiHoumaHungarianIcelanderIndian (Asian)IndonesianInupiatIranianIraqiIrishIroquoisIsraeliItalianJamaicanJapaneseJordanianKenyanKiowaKoreanLaotianLatvianLebaneseLiberianLithuanianLumbeeLuxembourgerMacedonianMalaysianMalteseMarshalleseMenomineeMexicanMexican American IndianMongolianMoroccanNative HawaiianNavajoNepaleseNew ZealanderNicaraguanNigerianNorthern EuropeanNorwegianOkinawanOsageOttawaPaiutePakistaniPalestinianPanamanianParaguayanPennsylvania GermanPeruvianPimaPolishPortuguesePotawatomiPuebloPuerto RicanPuget Sound SalishRomanianRussianSalvadoranSamoanScandinavianScotch-IrishScottishSeminoleSenegaleseSerbianShoshoneSierra LeoneanSiouxSlavicSlovakSloveneSomaliSouth AfricanSouth AmericanSouth American IndianSoviet UnionSpaniardSpanishSpanish AmericanSpanish American IndianSri LankanSubsaharan AfricanSudaneseSwedishSwissSyrianTaiwaneseThaiTlingit-HaidaTohono O'OdhamTonganTrinidadian and TobagonianTsimshianTurkishU.S. Virgin IslanderUgandanUkrainianUruguayanUteVenezuelanVietnameseWelshWest IndianYakamaYaquiYugoslavianYumanYup'ikZimbabwean
Immigration
NonimmigrantsImmigrantsAfghanistanAfricaAlbaniaArgentinaArmeniaAsiaAustraliaAustriaBahamasBangladeshBarbadosBelarusBelgiumBelizeBoliviaBosnia and HerzegovinaBrazilBulgariaBurma/MyanmarCabo VerdeCambodiaCameroonCanadaCaribbeanCentral AmericaChileChinaColombiaCongoCosta RicaCroatiaCubaCzechoslovakiaDenmarkDominicaDominican RepublicEastern AfricaEastern AsiaEastern EuropeEcuadorEgyptEl SalvadorEnglandEritreaEthiopiaEuropeFijiFranceGermanyGhanaGreeceGrenadaGuatemalaGuyanaHaitiHondurasHong KongHungaryIndiaIndonesiaIranIraqIrelandIsraelItalyJamaicaJapanJordanKazakhstanKenyaKoreaKuwaitLaosLatin AmericaLatviaLebanonLiberiaLithuaniaMalaysiaMexicoMicronesiaMiddle AfricaMoldovaMoroccoNepalNetherlandsNicaraguaNigeriaNorth AmericaNorth MacedoniaNorthern AfricaNorthern EuropeNorwayOceaniaPakistanPanamaPeruPhilippinesPolandPortugalRomaniaRussiaSaudi ArabiaScotlandSenegalSerbiaSierra LeoneSingaporeSomaliaSouth AfricaSouth AmericaSouth Central AsiaSouth Eastern AsiaSouthern EuropeSpainSri LankaSt. Vincent and the GrenadinesSudanSwedenSwitzerlandSyriaTaiwanThailandTrinidad and TobagoTurkeyUgandaUkraineUruguayUzbekistanVenezuelaVietnamWest IndiesWestern AfricaWestern AsiaWestern EuropeYemenZaireZimbabweAzores
Ethiopian
Race
Ancestry
AfghanAfricanAlaska NativeAlaskan AthabascanAlbanianAleutAlsatianAmericanApacheArabArapahoArgentineanArmenianAssyrian/Chaldean/SyriacAustralianAustrianBahamianBangladeshiBarbadianBasqueBelgianBelizeanBermudanBhutaneseBlackfeetBolivianBrazilianBritishBritish West IndianBulgarianBurmeseCajunCambodianCanadianCape VerdeanCarpatho RusynCelticCentral AmericanCentral American IndianCherokeeCheyenneChickasawChileanChineseChippewaChoctawColombianColvilleComancheCosta RicanCreeCreekCroatianCrowCubanCypriotCzechCzechoslovakianDanishDelawareDominicanDutchDutch West IndianEastern EuropeanEcuadorianEgyptianEnglishEstonianEthiopianEuropeanFijianFilipinoFinnishFrenchFrench American IndianFrench CanadianGermanGerman RussianGhanaianGreekGuamanian/ChamorroGuatemalanGuyaneseHaitianHmongHonduranHopiHoumaHungarianIcelanderIndian (Asian)IndonesianInupiatIranianIraqiIrishIroquoisIsraeliItalianJamaicanJapaneseJordanianKenyanKiowaKoreanLaotianLatvianLebaneseLiberianLithuanianLumbeeLuxembourgerMacedonianMalaysianMalteseMarshalleseMenomineeMexicanMexican American IndianMongolianMoroccanNative HawaiianNavajoNepaleseNew ZealanderNicaraguanNigerianNorthern EuropeanNorwegianOkinawanOsageOttawaPaiutePakistaniPalestinianPanamanianParaguayanPennsylvania GermanPeruvianPimaPolishPortuguesePotawatomiPuebloPuerto RicanPuget Sound SalishRomanianRussianSalvadoranSamoanScandinavianScotch-IrishScottishSeminoleSenegaleseSerbianShoshoneSierra LeoneanSiouxSlavicSlovakSloveneSomaliSouth AfricanSouth AmericanSouth American IndianSoviet UnionSpaniardSpanishSpanish AmericanSpanish American IndianSri LankanSubsaharan AfricanSudaneseSwedishSwissSyrianTaiwaneseThaiTlingit-HaidaTohono O'OdhamTonganTrinidadian and TobagonianTsimshianTurkishU.S. Virgin IslanderUgandanUkrainianUteVenezuelanVietnameseWelshWest IndianYakamaYaquiYugoslavianYumanYup'ikZimbabwean
Immigration
NonimmigrantsImmigrantsAfghanistanAfricaAlbaniaArgentinaArmeniaAsiaAustraliaAustriaBahamasBangladeshBarbadosBelarusBelgiumBelizeBoliviaBosnia and HerzegovinaBrazilBulgariaBurma/MyanmarCabo VerdeCambodiaCameroonCanadaCaribbeanCentral AmericaChileChinaColombiaCongoCosta RicaCroatiaCubaCzechoslovakiaDenmarkDominicaDominican RepublicEastern AfricaEastern AsiaEastern EuropeEcuadorEgyptEl SalvadorEnglandEritreaEthiopiaEuropeFijiFranceGermanyGhanaGreeceGrenadaGuatemalaGuyanaHaitiHondurasHong KongHungaryIndiaIndonesiaIranIraqIrelandIsraelItalyJamaicaJapanJordanKazakhstanKenyaKoreaKuwaitLaosLatin AmericaLatviaLebanonLiberiaLithuaniaMalaysiaMexicoMicronesiaMiddle AfricaMoldovaMoroccoNepalNetherlandsNicaraguaNigeriaNorth AmericaNorth MacedoniaNorthern AfricaNorthern EuropeNorwayOceaniaPakistanPanamaPeruPhilippinesPolandPortugalRomaniaRussiaSaudi ArabiaScotlandSenegalSerbiaSierra LeoneSingaporeSomaliaSouth AfricaSouth AmericaSouth Central AsiaSouth Eastern AsiaSouthern EuropeSpainSri LankaSt. Vincent and the GrenadinesSudanSwedenSwitzerlandSyriaTaiwanThailandTrinidad and TobagoTurkeyUgandaUkraineUruguayUzbekistanVenezuelaVietnamWest IndiesWestern AfricaWestern AsiaWestern EuropeYemenZaireZimbabweAzores
Female Unemployment
Income
Poverty
Unemployment
Labor Participation
Family Structure
Vehicle Availability
Education Level
Disability

Female Unemployment Comparison

Uruguayans

Ethiopians

Poor
Excellent
5.4%
FEMALE UNEMPLOYMENT
11.4/ 100
METRIC RATING
212th/ 347
METRIC RANK
5.1%
FEMALE UNEMPLOYMENT
85.7/ 100
METRIC RATING
129th/ 347
METRIC RANK

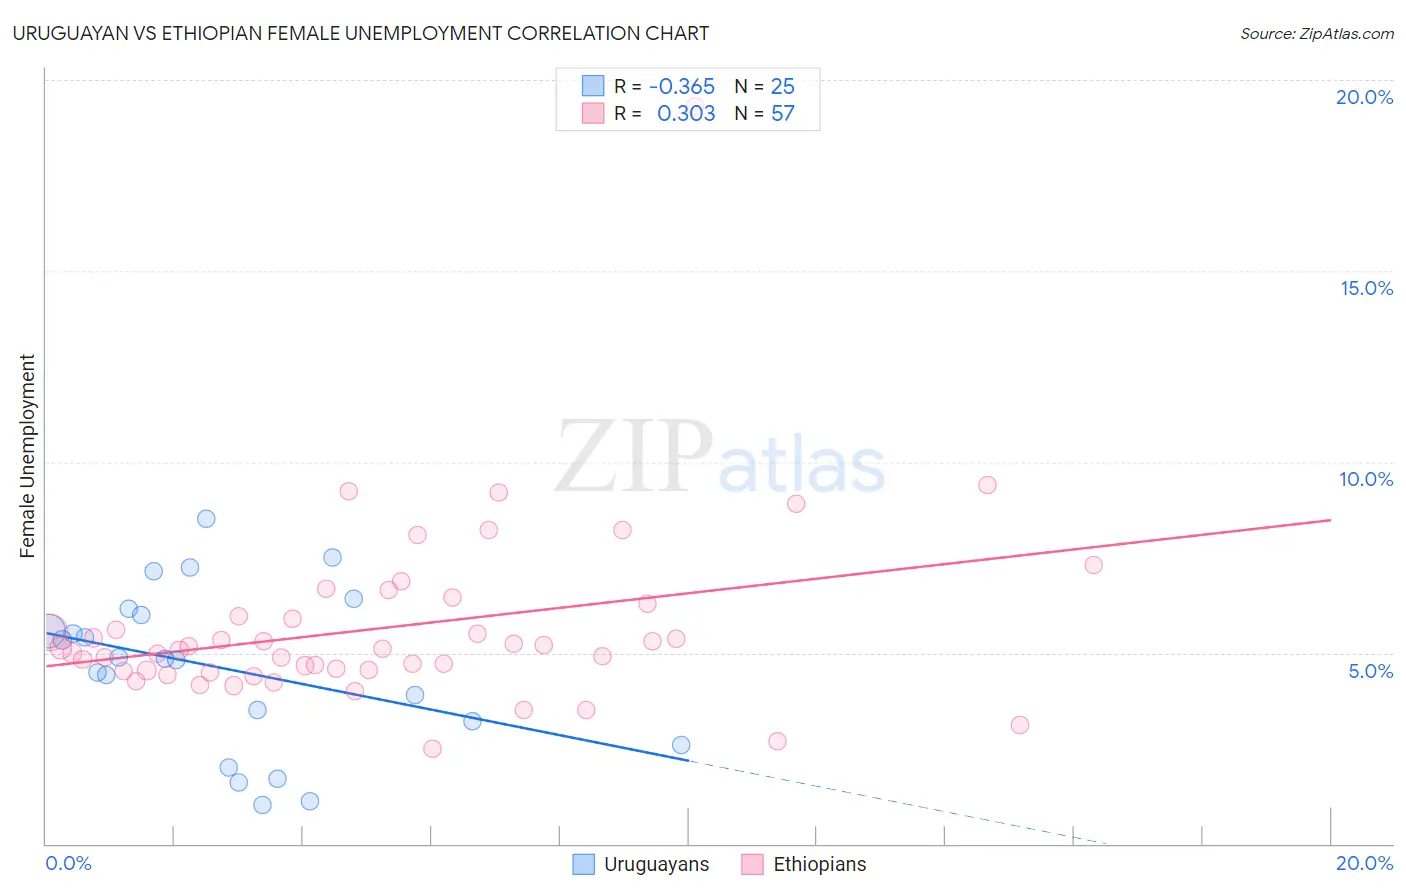
Uruguayan vs Ethiopian Female Unemployment Correlation Chart

The statistical analysis conducted on geographies consisting of 144,657,332 people shows a mild negative correlation between the proportion of Uruguayans and unemploymnet rate among females in the United States with a correlation coefficient (R) of -0.365 and weighted average of 5.4%. Similarly, the statistical analysis conducted on geographies consisting of 222,927,979 people shows a mild positive correlation between the proportion of Ethiopians and unemploymnet rate among females in the United States with a correlation coefficient (R) of 0.303 and weighted average of 5.1%, a difference of 5.9%.
Uruguayan vs Ethiopian Female Unemployment

Female Unemployment Correlation Summary

MeasurementUruguayanEthiopian
Minimum1.0%2.5%
Maximum8.5%19.3%
Range7.5%16.8%
Mean4.6%5.7%
Median4.9%5.1%
Interquartile 25% (IQ1)2.9%4.5%
Interquartile 75% (IQ3)6.1%6.1%
Interquartile Range (IQR)3.2%1.6%
Standard Deviation (Sample)2.1%2.4%
Standard Deviation (Population)2.0%2.4%

Similar Demographics by Female Unemployment

Demographics Similar to Uruguayans by Female Unemployment

In terms of female unemployment, the demographic groups most similar to Uruguayans are Ottawa (5.4%, a difference of 0.020%), Choctaw (5.4%, a difference of 0.12%), Samoan (5.4%, a difference of 0.12%), Seminole (5.4%, a difference of 0.17%), and Immigrants from Nicaragua (5.4%, a difference of 0.19%).
DemographicsRating | RankFemale Unemployment
Immigrants | Afghanistan
18.9
/100
|
#205
Poor
5.4%
Immigrants | Brazil
18.8
/100
|
#206
Poor
5.4%
Creek
15.4
/100
|
#207
Poor
5.4%
Immigrants | Costa Rica
13.7
/100
|
#208
Poor
5.4%
Koreans
13.4
/100
|
#209
Poor
5.4%
Choctaw
12.3
/100
|
#210
Poor
5.4%
Ottawa
11.6
/100
|
#211
Poor
5.4%
Uruguayans
11.4
/100
|
#212
Poor
5.4%
Samoans
10.6
/100
|
#213
Poor
5.4%
Seminole
10.3
/100
|
#214
Poor
5.4%
Immigrants | Nicaragua
10.2
/100
|
#215
Poor
5.4%
Comanche
10.0
/100
|
#216
Poor
5.4%
Peruvians
9.6
/100
|
#217
Tragic
5.4%
Bermudans
9.0
/100
|
#218
Tragic
5.4%
South Americans
8.6
/100
|
#219
Tragic
5.4%

Demographics Similar to Ethiopians by Female Unemployment

In terms of female unemployment, the demographic groups most similar to Ethiopians are Chilean (5.1%, a difference of 0.010%), Maltese (5.1%, a difference of 0.030%), Immigrants from Hungary (5.1%, a difference of 0.040%), Immigrants from Ethiopia (5.1%, a difference of 0.050%), and Immigrants from Korea (5.1%, a difference of 0.080%).
DemographicsRating | RankFemale Unemployment
Immigrants | Germany
87.6
/100
|
#122
Excellent
5.1%
Immigrants | South Africa
87.6
/100
|
#123
Excellent
5.1%
Immigrants | Europe
87.2
/100
|
#124
Excellent
5.1%
Basques
86.5
/100
|
#125
Excellent
5.1%
Immigrants | Korea
86.3
/100
|
#126
Excellent
5.1%
Immigrants | Hungary
86.0
/100
|
#127
Excellent
5.1%
Chileans
85.8
/100
|
#128
Excellent
5.1%
Ethiopians
85.7
/100
|
#129
Excellent
5.1%
Maltese
85.5
/100
|
#130
Excellent
5.1%
Immigrants | Ethiopia
85.4
/100
|
#131
Excellent
5.1%
Immigrants | Sri Lanka
85.0
/100
|
#132
Excellent
5.1%
Immigrants | Hong Kong
84.8
/100
|
#133
Excellent
5.1%
Immigrants | Eritrea
84.6
/100
|
#134
Excellent
5.1%
Immigrants | Latvia
84.6
/100
|
#135
Excellent
5.1%
Indians (Asian)
84.2
/100
|
#136
Excellent
5.1%