Immigrants from Eritrea vs Ethiopian Female Unemployment
COMPARE
Immigrants from Eritrea
Ethiopian
Female Unemployment
Female Unemployment Comparison
Immigrants from Eritrea
Ethiopians
5.1%
FEMALE UNEMPLOYMENT
84.6/ 100
METRIC RATING
134th/ 347
METRIC RANK
5.1%
FEMALE UNEMPLOYMENT
85.7/ 100
METRIC RATING
129th/ 347
METRIC RANK
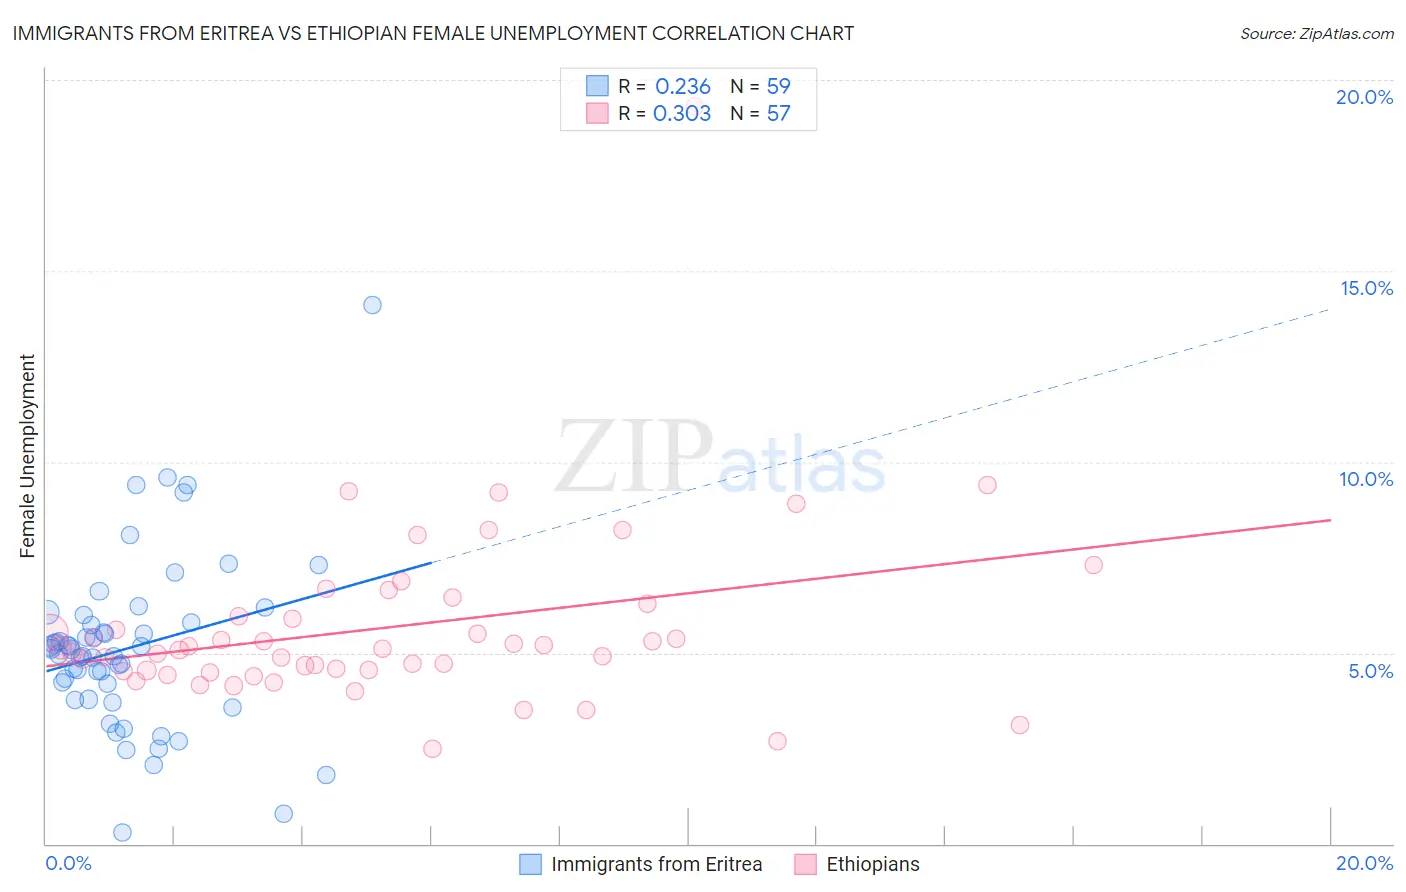
Immigrants from Eritrea vs Ethiopian Female Unemployment Correlation Chart
The statistical analysis conducted on geographies consisting of 104,834,311 people shows a weak positive correlation between the proportion of Immigrants from Eritrea and unemploymnet rate among females in the United States with a correlation coefficient (R) of 0.236 and weighted average of 5.1%. Similarly, the statistical analysis conducted on geographies consisting of 222,927,979 people shows a mild positive correlation between the proportion of Ethiopians and unemploymnet rate among females in the United States with a correlation coefficient (R) of 0.303 and weighted average of 5.1%, a difference of 0.14%.
Female Unemployment Correlation Summary
| Measurement | Immigrants from Eritrea | Ethiopian |
| Minimum | 0.30% | 2.5% |
| Maximum | 14.1% | 19.3% |
| Range | 13.8% | 16.8% |
| Mean | 5.1% | 5.7% |
| Median | 5.1% | 5.1% |
| Interquartile 25% (IQ1) | 3.8% | 4.5% |
| Interquartile 75% (IQ3) | 5.8% | 6.1% |
| Interquartile Range (IQR) | 2.0% | 1.6% |
| Standard Deviation (Sample) | 2.3% | 2.4% |
| Standard Deviation (Population) | 2.2% | 2.4% |
Demographics Similar to Immigrants from Eritrea and Ethiopians by Female Unemployment
In terms of female unemployment, the demographic groups most similar to Immigrants from Eritrea are Immigrants from Latvia (5.1%, a difference of 0.0%), Immigrants from Hong Kong (5.1%, a difference of 0.020%), Immigrants from Sri Lanka (5.1%, a difference of 0.040%), Indian (Asian) (5.1%, a difference of 0.050%), and Immigrants from Ethiopia (5.1%, a difference of 0.090%). Similarly, the demographic groups most similar to Ethiopians are Chilean (5.1%, a difference of 0.010%), Maltese (5.1%, a difference of 0.030%), Immigrants from Hungary (5.1%, a difference of 0.040%), Immigrants from Ethiopia (5.1%, a difference of 0.050%), and Immigrants from Korea (5.1%, a difference of 0.080%).
| Demographics | Rating | Rank | Female Unemployment |
| Immigrants | Western Europe | 88.1 /100 | #121 | Excellent 5.1% |
| Immigrants | Germany | 87.6 /100 | #122 | Excellent 5.1% |
| Immigrants | South Africa | 87.6 /100 | #123 | Excellent 5.1% |
| Immigrants | Europe | 87.2 /100 | #124 | Excellent 5.1% |
| Basques | 86.5 /100 | #125 | Excellent 5.1% |
| Immigrants | Korea | 86.3 /100 | #126 | Excellent 5.1% |
| Immigrants | Hungary | 86.0 /100 | #127 | Excellent 5.1% |
| Chileans | 85.8 /100 | #128 | Excellent 5.1% |
| Ethiopians | 85.7 /100 | #129 | Excellent 5.1% |
| Maltese | 85.5 /100 | #130 | Excellent 5.1% |
| Immigrants | Ethiopia | 85.4 /100 | #131 | Excellent 5.1% |
| Immigrants | Sri Lanka | 85.0 /100 | #132 | Excellent 5.1% |
| Immigrants | Hong Kong | 84.8 /100 | #133 | Excellent 5.1% |
| Immigrants | Eritrea | 84.6 /100 | #134 | Excellent 5.1% |
| Immigrants | Latvia | 84.6 /100 | #135 | Excellent 5.1% |
| Indians (Asian) | 84.2 /100 | #136 | Excellent 5.1% |
| Pakistanis | 83.8 /100 | #137 | Excellent 5.1% |
| Chickasaw | 83.2 /100 | #138 | Excellent 5.1% |
| Immigrants | Eastern Asia | 83.0 /100 | #139 | Excellent 5.1% |
| Immigrants | France | 82.7 /100 | #140 | Excellent 5.1% |
| Immigrants | Eastern Europe | 81.5 /100 | #141 | Excellent 5.1% |