Immigrants from France vs Ethiopian Female Unemployment
COMPARE
Immigrants from France
Ethiopian
Female Unemployment
Female Unemployment Comparison
Immigrants from France
Ethiopians
5.1%
FEMALE UNEMPLOYMENT
82.7/ 100
METRIC RATING
140th/ 347
METRIC RANK
5.1%
FEMALE UNEMPLOYMENT
85.7/ 100
METRIC RATING
129th/ 347
METRIC RANK
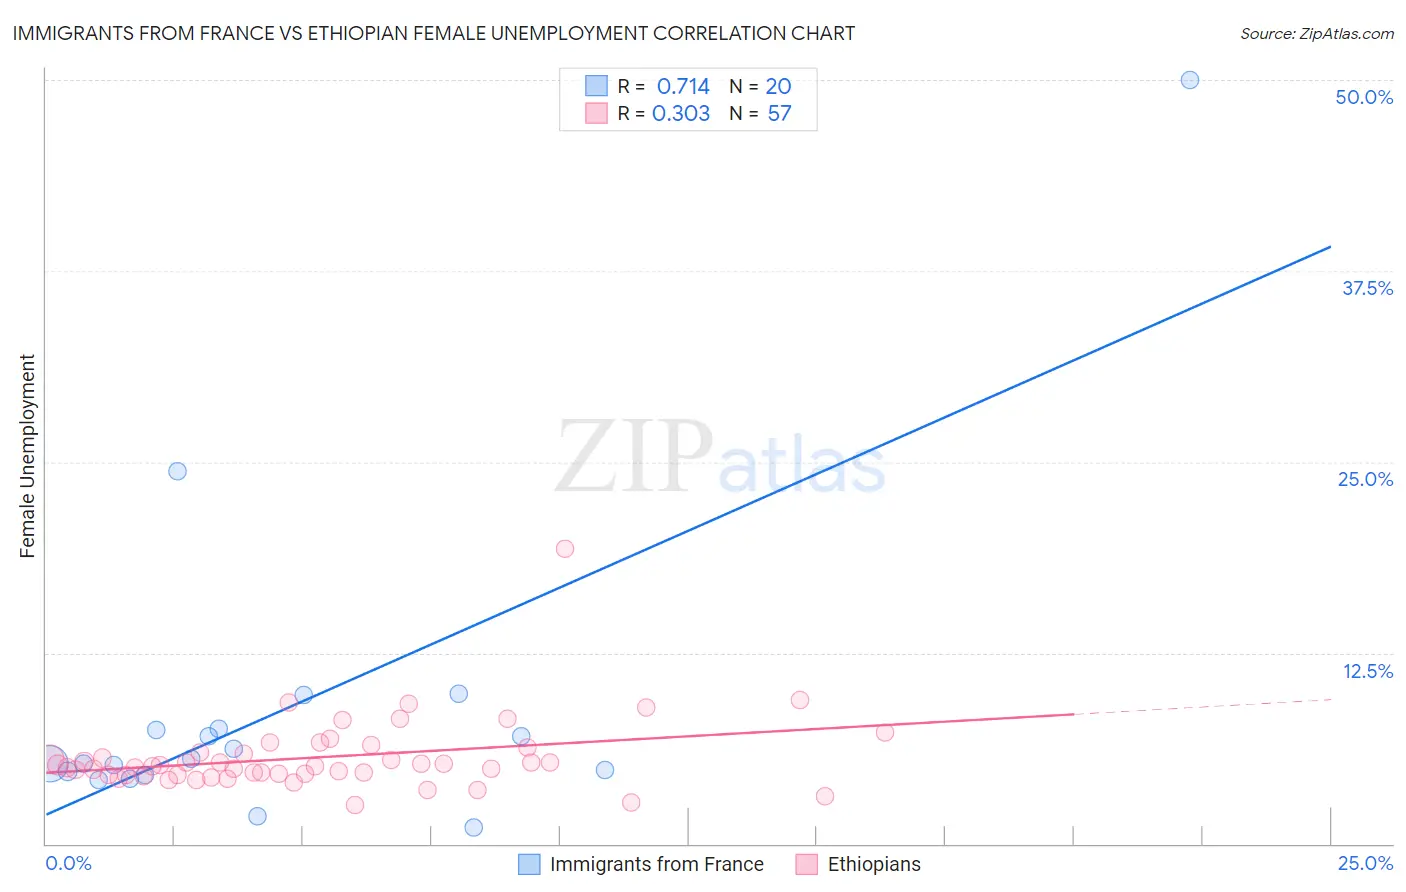
Immigrants from France vs Ethiopian Female Unemployment Correlation Chart
The statistical analysis conducted on geographies consisting of 287,167,055 people shows a strong positive correlation between the proportion of Immigrants from France and unemploymnet rate among females in the United States with a correlation coefficient (R) of 0.714 and weighted average of 5.1%. Similarly, the statistical analysis conducted on geographies consisting of 222,927,979 people shows a mild positive correlation between the proportion of Ethiopians and unemploymnet rate among females in the United States with a correlation coefficient (R) of 0.303 and weighted average of 5.1%, a difference of 0.36%.
Female Unemployment Correlation Summary
| Measurement | Immigrants from France | Ethiopian |
| Minimum | 1.1% | 2.5% |
| Maximum | 50.0% | 19.3% |
| Range | 48.9% | 16.8% |
| Mean | 8.8% | 5.7% |
| Median | 5.4% | 5.1% |
| Interquartile 25% (IQ1) | 4.6% | 4.5% |
| Interquartile 75% (IQ3) | 7.5% | 6.1% |
| Interquartile Range (IQR) | 2.9% | 1.6% |
| Standard Deviation (Sample) | 10.8% | 2.4% |
| Standard Deviation (Population) | 10.5% | 2.4% |
Demographics Similar to Immigrants from France and Ethiopians by Female Unemployment
In terms of female unemployment, the demographic groups most similar to Immigrants from France are Immigrants from Eastern Asia (5.1%, a difference of 0.040%), Chickasaw (5.1%, a difference of 0.060%), Immigrants from Eastern Europe (5.1%, a difference of 0.12%), Pakistani (5.1%, a difference of 0.13%), and Indian (Asian) (5.1%, a difference of 0.17%). Similarly, the demographic groups most similar to Ethiopians are Chilean (5.1%, a difference of 0.010%), Maltese (5.1%, a difference of 0.030%), Immigrants from Hungary (5.1%, a difference of 0.040%), Immigrants from Ethiopia (5.1%, a difference of 0.050%), and Immigrants from Korea (5.1%, a difference of 0.080%).
| Demographics | Rating | Rank | Female Unemployment |
| Immigrants | Europe | 87.2 /100 | #124 | Excellent 5.1% |
| Basques | 86.5 /100 | #125 | Excellent 5.1% |
| Immigrants | Korea | 86.3 /100 | #126 | Excellent 5.1% |
| Immigrants | Hungary | 86.0 /100 | #127 | Excellent 5.1% |
| Chileans | 85.8 /100 | #128 | Excellent 5.1% |
| Ethiopians | 85.7 /100 | #129 | Excellent 5.1% |
| Maltese | 85.5 /100 | #130 | Excellent 5.1% |
| Immigrants | Ethiopia | 85.4 /100 | #131 | Excellent 5.1% |
| Immigrants | Sri Lanka | 85.0 /100 | #132 | Excellent 5.1% |
| Immigrants | Hong Kong | 84.8 /100 | #133 | Excellent 5.1% |
| Immigrants | Eritrea | 84.6 /100 | #134 | Excellent 5.1% |
| Immigrants | Latvia | 84.6 /100 | #135 | Excellent 5.1% |
| Indians (Asian) | 84.2 /100 | #136 | Excellent 5.1% |
| Pakistanis | 83.8 /100 | #137 | Excellent 5.1% |
| Chickasaw | 83.2 /100 | #138 | Excellent 5.1% |
| Immigrants | Eastern Asia | 83.0 /100 | #139 | Excellent 5.1% |
| Immigrants | France | 82.7 /100 | #140 | Excellent 5.1% |
| Immigrants | Eastern Europe | 81.5 /100 | #141 | Excellent 5.1% |
| Palestinians | 80.8 /100 | #142 | Excellent 5.1% |
| Immigrants | Kazakhstan | 80.7 /100 | #143 | Excellent 5.1% |
| Immigrants | Jordan | 80.4 /100 | #144 | Excellent 5.1% |