Macedonian vs Ethiopian Female Unemployment
COMPARE
Macedonian
Ethiopian
Female Unemployment
Female Unemployment Comparison
Macedonians
Ethiopians
5.1%
FEMALE UNEMPLOYMENT
92.4/ 100
METRIC RATING
110th/ 347
METRIC RANK
5.1%
FEMALE UNEMPLOYMENT
85.7/ 100
METRIC RATING
129th/ 347
METRIC RANK
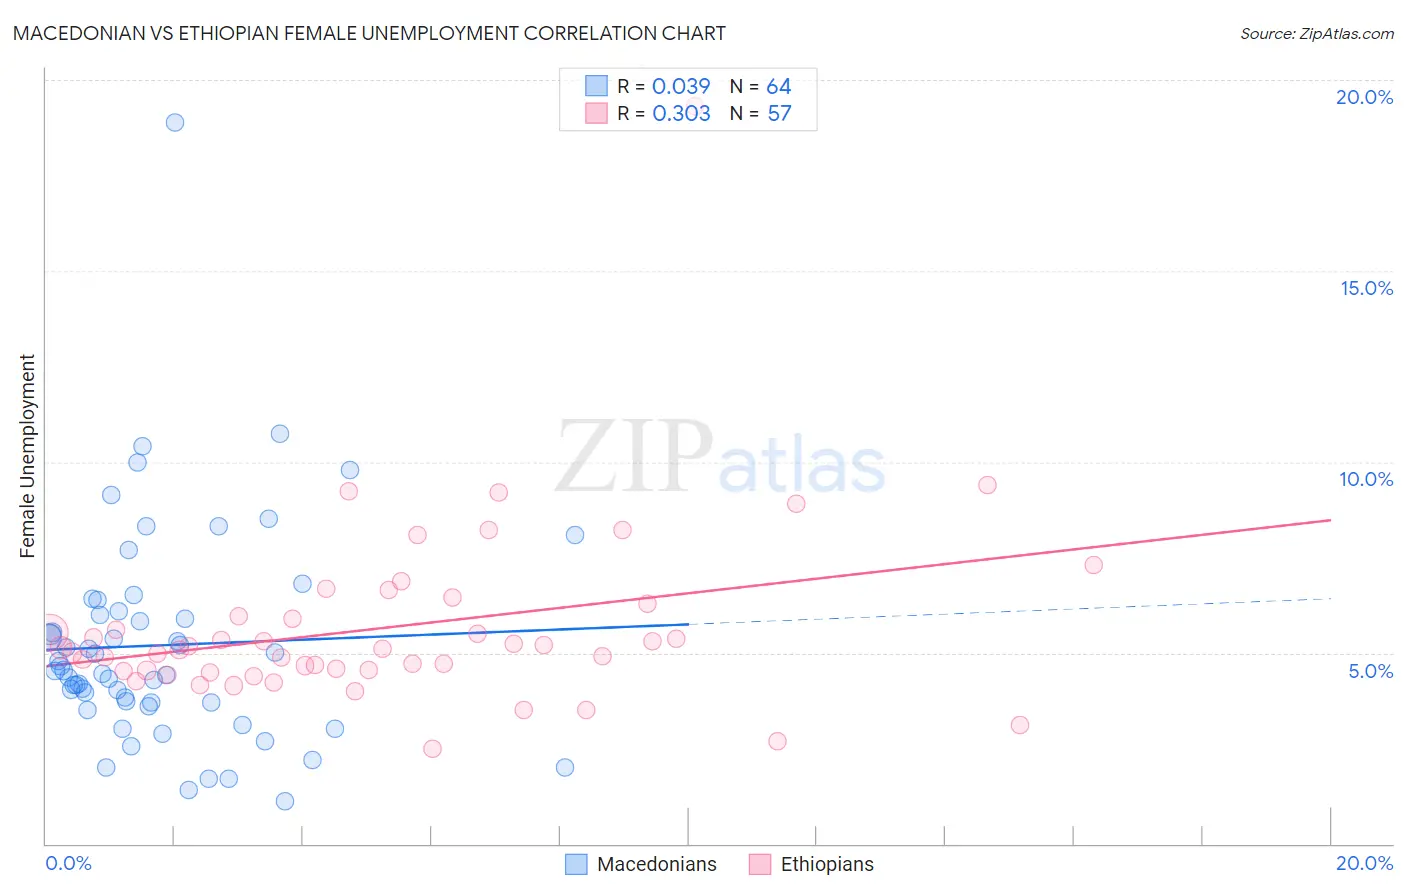
Macedonian vs Ethiopian Female Unemployment Correlation Chart
The statistical analysis conducted on geographies consisting of 132,466,796 people shows no correlation between the proportion of Macedonians and unemploymnet rate among females in the United States with a correlation coefficient (R) of 0.039 and weighted average of 5.1%. Similarly, the statistical analysis conducted on geographies consisting of 222,927,979 people shows a mild positive correlation between the proportion of Ethiopians and unemploymnet rate among females in the United States with a correlation coefficient (R) of 0.303 and weighted average of 5.1%, a difference of 1.1%.
Female Unemployment Correlation Summary
| Measurement | Macedonian | Ethiopian |
| Minimum | 1.1% | 2.5% |
| Maximum | 18.9% | 19.3% |
| Range | 17.8% | 16.8% |
| Mean | 5.2% | 5.7% |
| Median | 4.5% | 5.1% |
| Interquartile 25% (IQ1) | 3.7% | 4.5% |
| Interquartile 75% (IQ3) | 6.0% | 6.1% |
| Interquartile Range (IQR) | 2.3% | 1.6% |
| Standard Deviation (Sample) | 2.8% | 2.4% |
| Standard Deviation (Population) | 2.8% | 2.4% |
Demographics Similar to Macedonians and Ethiopians by Female Unemployment
In terms of female unemployment, the demographic groups most similar to Macedonians are Immigrants from Burma/Myanmar (5.1%, a difference of 0.030%), Estonian (5.1%, a difference of 0.060%), Immigrants from Eastern Africa (5.1%, a difference of 0.10%), Immigrants from Saudi Arabia (5.1%, a difference of 0.24%), and Immigrants from Turkey (5.1%, a difference of 0.28%). Similarly, the demographic groups most similar to Ethiopians are Chilean (5.1%, a difference of 0.010%), Immigrants from Hungary (5.1%, a difference of 0.040%), Immigrants from Korea (5.1%, a difference of 0.080%), Basque (5.1%, a difference of 0.10%), and Immigrants from Europe (5.1%, a difference of 0.20%).
| Demographics | Rating | Rank | Female Unemployment |
| Immigrants | Eastern Africa | 92.8 /100 | #109 | Exceptional 5.1% |
| Macedonians | 92.4 /100 | #110 | Exceptional 5.1% |
| Immigrants | Burma/Myanmar | 92.3 /100 | #111 | Exceptional 5.1% |
| Estonians | 92.1 /100 | #112 | Exceptional 5.1% |
| Immigrants | Saudi Arabia | 91.2 /100 | #113 | Exceptional 5.1% |
| Immigrants | Turkey | 91.0 /100 | #114 | Exceptional 5.1% |
| Lebanese | 91.0 /100 | #115 | Exceptional 5.1% |
| Americans | 90.5 /100 | #116 | Exceptional 5.1% |
| Jordanians | 90.3 /100 | #117 | Exceptional 5.1% |
| Immigrants | Croatia | 89.9 /100 | #118 | Excellent 5.1% |
| Immigrants | North Macedonia | 88.3 /100 | #119 | Excellent 5.1% |
| Immigrants | Romania | 88.1 /100 | #120 | Excellent 5.1% |
| Immigrants | Western Europe | 88.1 /100 | #121 | Excellent 5.1% |
| Immigrants | Germany | 87.6 /100 | #122 | Excellent 5.1% |
| Immigrants | South Africa | 87.6 /100 | #123 | Excellent 5.1% |
| Immigrants | Europe | 87.2 /100 | #124 | Excellent 5.1% |
| Basques | 86.5 /100 | #125 | Excellent 5.1% |
| Immigrants | Korea | 86.3 /100 | #126 | Excellent 5.1% |
| Immigrants | Hungary | 86.0 /100 | #127 | Excellent 5.1% |
| Chileans | 85.8 /100 | #128 | Excellent 5.1% |
| Ethiopians | 85.7 /100 | #129 | Excellent 5.1% |