Kenyan vs Navajo Unemployment Among Women with Children Under 6 years
COMPARE
Kenyan
Navajo
Unemployment Among Women with Children Under 6 years
Unemployment Among Women with Children Under 6 years Comparison
Kenyans
Navajo
7.6%
UNEMPLOYMENT AMONG WOMEN WITH CHILDREN UNDER 6 YEARS
62.5/ 100
METRIC RATING
167th/ 347
METRIC RANK
13.5%
UNEMPLOYMENT AMONG WOMEN WITH CHILDREN UNDER 6 YEARS
0.0/ 100
METRIC RATING
339th/ 347
METRIC RANK
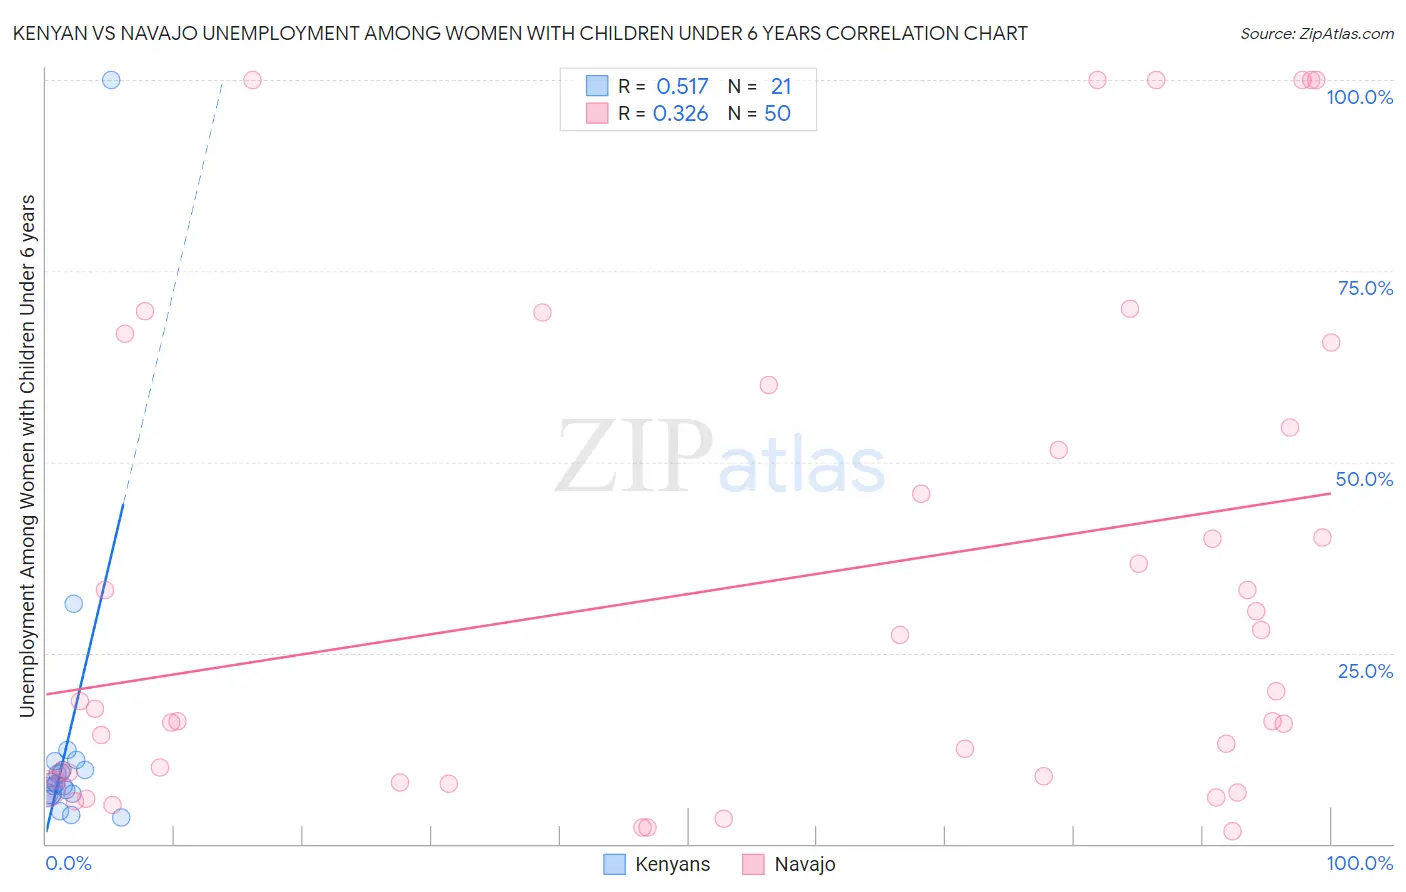
Kenyan vs Navajo Unemployment Among Women with Children Under 6 years Correlation Chart
The statistical analysis conducted on geographies consisting of 147,179,108 people shows a substantial positive correlation between the proportion of Kenyans and unemployment rate among women with children under the age of 6 in the United States with a correlation coefficient (R) of 0.517 and weighted average of 7.6%. Similarly, the statistical analysis conducted on geographies consisting of 189,295,070 people shows a mild positive correlation between the proportion of Navajo and unemployment rate among women with children under the age of 6 in the United States with a correlation coefficient (R) of 0.326 and weighted average of 13.5%, a difference of 78.0%.
Unemployment Among Women with Children Under 6 years Correlation Summary
| Measurement | Kenyan | Navajo |
| Minimum | 3.5% | 1.7% |
| Maximum | 100.0% | 100.0% |
| Range | 96.5% | 98.3% |
| Mean | 13.3% | 33.8% |
| Median | 7.9% | 18.1% |
| Interquartile 25% (IQ1) | 6.5% | 8.4% |
| Interquartile 75% (IQ3) | 10.2% | 54.5% |
| Interquartile Range (IQR) | 3.8% | 46.1% |
| Standard Deviation (Sample) | 20.6% | 32.0% |
| Standard Deviation (Population) | 20.2% | 31.7% |
Similar Demographics by Unemployment Among Women with Children Under 6 years
Demographics Similar to Kenyans by Unemployment Among Women with Children Under 6 years
In terms of unemployment among women with children under 6 years, the demographic groups most similar to Kenyans are Belgian (7.6%, a difference of 0.070%), Immigrants from Canada (7.6%, a difference of 0.070%), Immigrants from Scotland (7.6%, a difference of 0.080%), Czech (7.6%, a difference of 0.19%), and Immigrants from South America (7.6%, a difference of 0.22%).
| Demographics | Rating | Rank | Unemployment Among Women with Children Under 6 years |
| Bolivians | 70.8 /100 | #160 | Good 7.5% |
| Immigrants | Western Asia | 70.2 /100 | #161 | Good 7.5% |
| Immigrants | Lithuania | 68.8 /100 | #162 | Good 7.5% |
| British | 66.3 /100 | #163 | Good 7.6% |
| Ugandans | 65.8 /100 | #164 | Good 7.6% |
| Immigrants | South America | 65.6 /100 | #165 | Good 7.6% |
| Belgians | 63.5 /100 | #166 | Good 7.6% |
| Kenyans | 62.5 /100 | #167 | Good 7.6% |
| Immigrants | Canada | 61.6 /100 | #168 | Good 7.6% |
| Immigrants | Scotland | 61.3 /100 | #169 | Good 7.6% |
| Czechs | 59.8 /100 | #170 | Average 7.6% |
| Immigrants | Grenada | 59.0 /100 | #171 | Average 7.6% |
| Immigrants | North America | 57.7 /100 | #172 | Average 7.6% |
| Cree | 51.6 /100 | #173 | Average 7.6% |
| Immigrants | Laos | 50.0 /100 | #174 | Average 7.6% |
Demographics Similar to Navajo by Unemployment Among Women with Children Under 6 years
In terms of unemployment among women with children under 6 years, the demographic groups most similar to Navajo are Immigrants from Yemen (13.5%, a difference of 0.0%), Pima (13.4%, a difference of 0.40%), Chippewa (13.3%, a difference of 1.2%), Lumbee (13.8%, a difference of 2.2%), and Shoshone (13.2%, a difference of 2.3%).
| Demographics | Rating | Rank | Unemployment Among Women with Children Under 6 years |
| Sioux | 0.0 /100 | #332 | Tragic 11.5% |
| Natives/Alaskans | 0.0 /100 | #333 | Tragic 11.5% |
| Apache | 0.0 /100 | #334 | Tragic 12.3% |
| Puerto Ricans | 0.0 /100 | #335 | Tragic 12.5% |
| Shoshone | 0.0 /100 | #336 | Tragic 13.2% |
| Chippewa | 0.0 /100 | #337 | Tragic 13.3% |
| Pima | 0.0 /100 | #338 | Tragic 13.4% |
| Navajo | 0.0 /100 | #339 | Tragic 13.5% |
| Immigrants | Yemen | 0.0 /100 | #340 | Tragic 13.5% |
| Lumbee | 0.0 /100 | #341 | Tragic 13.8% |
| Yuman | 0.0 /100 | #342 | Tragic 14.6% |
| Crow | 0.0 /100 | #343 | Tragic 14.6% |
| Hopi | 0.0 /100 | #344 | Tragic 16.8% |
| Inupiat | 0.0 /100 | #345 | Tragic 17.7% |
| Arapaho | 0.0 /100 | #346 | Tragic 19.0% |