Swedish vs Colombian Unemployment Among Women with Children Under 6 years
COMPARE
Swedish
Colombian
Unemployment Among Women with Children Under 6 years
Unemployment Among Women with Children Under 6 years Comparison
Swedes
Colombians
7.4%
UNEMPLOYMENT AMONG WOMEN WITH CHILDREN UNDER 6 YEARS
88.4/ 100
METRIC RATING
130th/ 347
METRIC RANK
7.5%
UNEMPLOYMENT AMONG WOMEN WITH CHILDREN UNDER 6 YEARS
76.1/ 100
METRIC RATING
149th/ 347
METRIC RANK
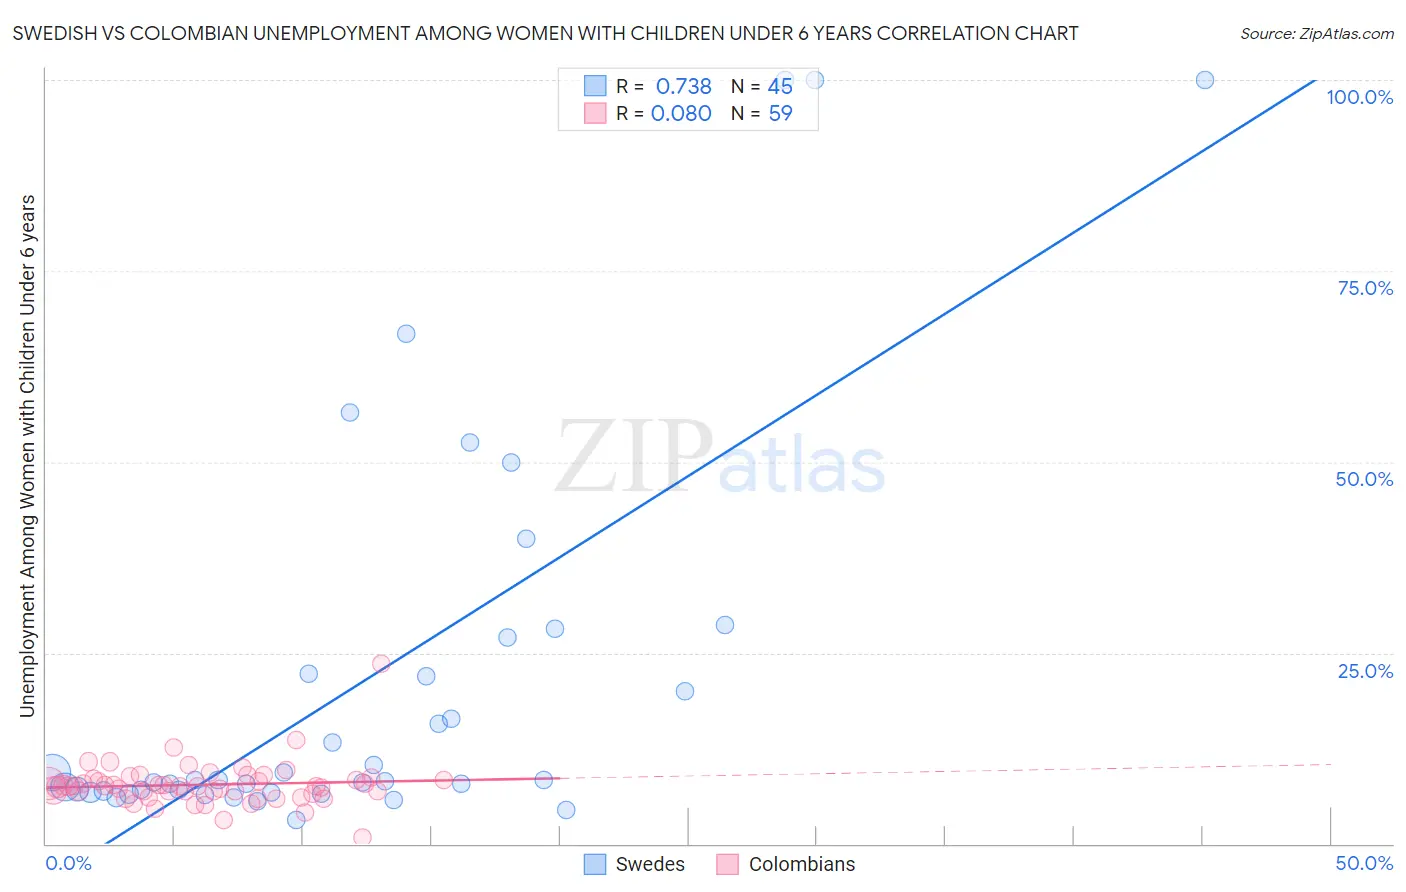
Swedish vs Colombian Unemployment Among Women with Children Under 6 years Correlation Chart
The statistical analysis conducted on geographies consisting of 362,245,772 people shows a strong positive correlation between the proportion of Swedes and unemployment rate among women with children under the age of 6 in the United States with a correlation coefficient (R) of 0.738 and weighted average of 7.4%. Similarly, the statistical analysis conducted on geographies consisting of 319,026,825 people shows a slight positive correlation between the proportion of Colombians and unemployment rate among women with children under the age of 6 in the United States with a correlation coefficient (R) of 0.080 and weighted average of 7.5%, a difference of 1.5%.
Unemployment Among Women with Children Under 6 years Correlation Summary
| Measurement | Swedish | Colombian |
| Minimum | 3.1% | 0.90% |
| Maximum | 100.0% | 23.5% |
| Range | 96.9% | 22.6% |
| Mean | 21.3% | 7.7% |
| Median | 8.4% | 7.5% |
| Interquartile 25% (IQ1) | 6.8% | 6.6% |
| Interquartile 75% (IQ3) | 24.6% | 8.5% |
| Interquartile Range (IQR) | 17.8% | 1.9% |
| Standard Deviation (Sample) | 26.1% | 2.9% |
| Standard Deviation (Population) | 25.8% | 2.9% |
Demographics Similar to Swedes and Colombians by Unemployment Among Women with Children Under 6 years
In terms of unemployment among women with children under 6 years, the demographic groups most similar to Swedes are Ukrainian (7.4%, a difference of 0.040%), Slovene (7.4%, a difference of 0.14%), Immigrants from Armenia (7.4%, a difference of 0.17%), Immigrants from Uganda (7.4%, a difference of 0.29%), and Immigrants from Bolivia (7.4%, a difference of 0.40%). Similarly, the demographic groups most similar to Colombians are Immigrants from Brazil (7.5%, a difference of 0.12%), Immigrants from Oceania (7.5%, a difference of 0.22%), Immigrants from Jordan (7.5%, a difference of 0.27%), Japanese (7.5%, a difference of 0.27%), and European (7.5%, a difference of 0.30%).
| Demographics | Rating | Rank | Unemployment Among Women with Children Under 6 years |
| Slovenes | 89.2 /100 | #129 | Excellent 7.4% |
| Swedes | 88.4 /100 | #130 | Excellent 7.4% |
| Ukrainians | 88.2 /100 | #131 | Excellent 7.4% |
| Immigrants | Armenia | 87.4 /100 | #132 | Excellent 7.4% |
| Immigrants | Uganda | 86.5 /100 | #133 | Excellent 7.4% |
| Immigrants | Bolivia | 85.7 /100 | #134 | Excellent 7.4% |
| Immigrants | Northern Africa | 85.3 /100 | #135 | Excellent 7.4% |
| Immigrants | Morocco | 84.9 /100 | #136 | Excellent 7.4% |
| Immigrants | Cambodia | 84.6 /100 | #137 | Excellent 7.4% |
| Immigrants | Norway | 84.1 /100 | #138 | Excellent 7.4% |
| Immigrants | Colombia | 83.9 /100 | #139 | Excellent 7.4% |
| Scandinavians | 83.0 /100 | #140 | Excellent 7.4% |
| Greeks | 82.6 /100 | #141 | Excellent 7.4% |
| Immigrants | Argentina | 81.5 /100 | #142 | Excellent 7.5% |
| Koreans | 81.3 /100 | #143 | Excellent 7.5% |
| Europeans | 79.1 /100 | #144 | Good 7.5% |
| Immigrants | Jordan | 78.9 /100 | #145 | Good 7.5% |
| Japanese | 78.9 /100 | #146 | Good 7.5% |
| Immigrants | Oceania | 78.4 /100 | #147 | Good 7.5% |
| Immigrants | Brazil | 77.3 /100 | #148 | Good 7.5% |
| Colombians | 76.1 /100 | #149 | Good 7.5% |