Maltese vs Navajo Unemployment Among Women with Children Under 6 years
COMPARE
Maltese
Navajo
Unemployment Among Women with Children Under 6 years
Unemployment Among Women with Children Under 6 years Comparison
Maltese
Navajo
6.9%
UNEMPLOYMENT AMONG WOMEN WITH CHILDREN UNDER 6 YEARS
99.7/ 100
METRIC RATING
63rd/ 347
METRIC RANK
13.5%
UNEMPLOYMENT AMONG WOMEN WITH CHILDREN UNDER 6 YEARS
0.0/ 100
METRIC RATING
339th/ 347
METRIC RANK
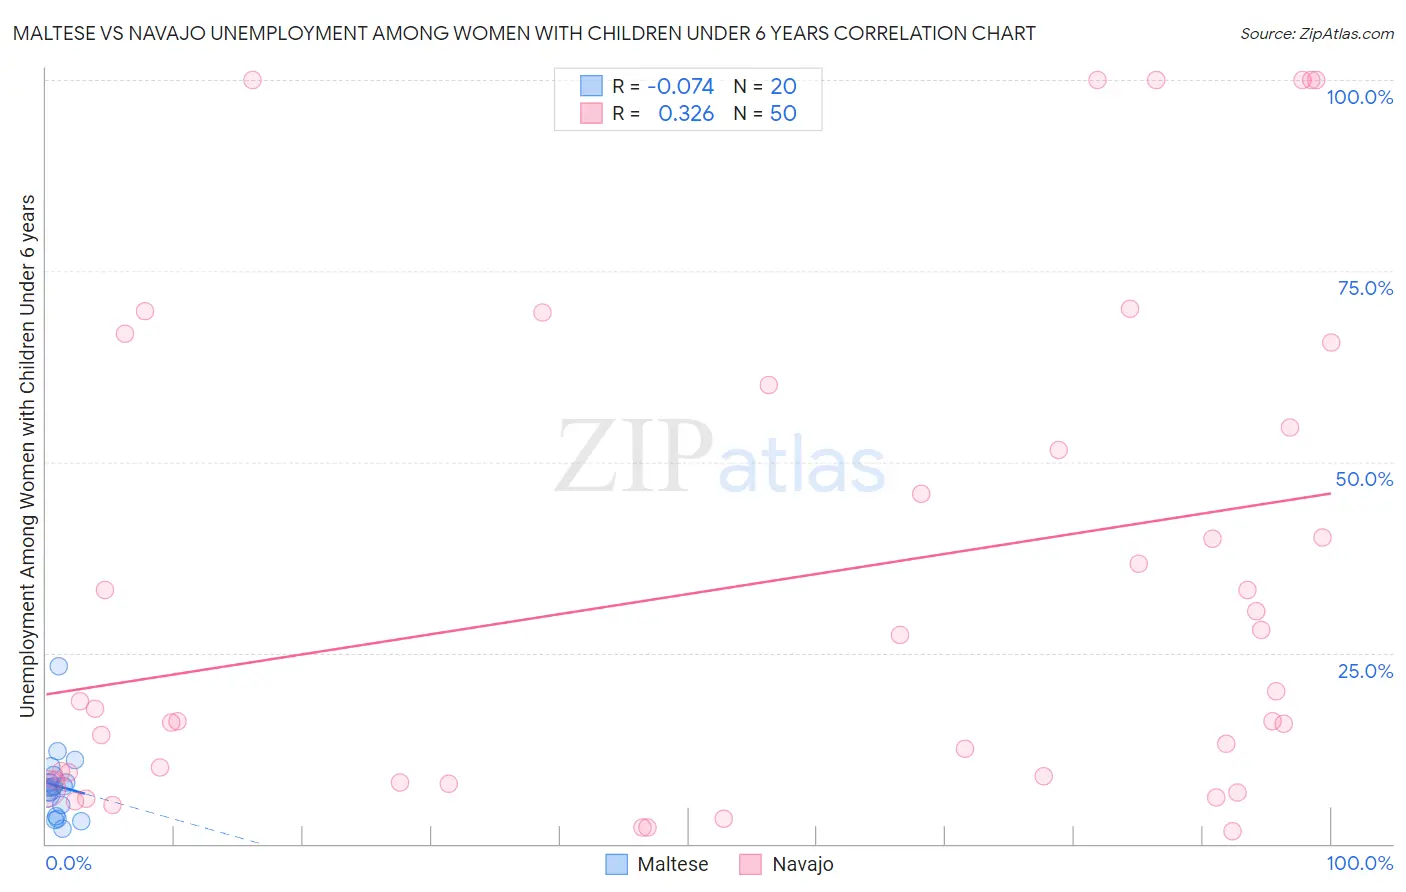
Maltese vs Navajo Unemployment Among Women with Children Under 6 years Correlation Chart
The statistical analysis conducted on geographies consisting of 109,228,269 people shows a slight negative correlation between the proportion of Maltese and unemployment rate among women with children under the age of 6 in the United States with a correlation coefficient (R) of -0.074 and weighted average of 6.9%. Similarly, the statistical analysis conducted on geographies consisting of 189,295,070 people shows a mild positive correlation between the proportion of Navajo and unemployment rate among women with children under the age of 6 in the United States with a correlation coefficient (R) of 0.326 and weighted average of 13.5%, a difference of 95.3%.
Unemployment Among Women with Children Under 6 years Correlation Summary
| Measurement | Maltese | Navajo |
| Minimum | 2.0% | 1.7% |
| Maximum | 23.3% | 100.0% |
| Range | 21.3% | 98.3% |
| Mean | 7.6% | 33.8% |
| Median | 7.4% | 18.1% |
| Interquartile 25% (IQ1) | 4.3% | 8.4% |
| Interquartile 75% (IQ3) | 8.5% | 54.5% |
| Interquartile Range (IQR) | 4.2% | 46.1% |
| Standard Deviation (Sample) | 4.6% | 32.0% |
| Standard Deviation (Population) | 4.5% | 31.7% |
Similar Demographics by Unemployment Among Women with Children Under 6 years
Demographics Similar to Maltese by Unemployment Among Women with Children Under 6 years
In terms of unemployment among women with children under 6 years, the demographic groups most similar to Maltese are Somali (6.9%, a difference of 0.050%), Immigrants from France (6.9%, a difference of 0.090%), Tongan (6.9%, a difference of 0.10%), Immigrants from Kuwait (6.9%, a difference of 0.25%), and Immigrants from Sri Lanka (6.9%, a difference of 0.46%).
| Demographics | Rating | Rank | Unemployment Among Women with Children Under 6 years |
| Immigrants | Ethiopia | 99.8 /100 | #56 | Exceptional 6.9% |
| Icelanders | 99.8 /100 | #57 | Exceptional 6.9% |
| Immigrants | Turkey | 99.8 /100 | #58 | Exceptional 6.9% |
| Immigrants | Serbia | 99.8 /100 | #59 | Exceptional 6.9% |
| Immigrants | Sri Lanka | 99.8 /100 | #60 | Exceptional 6.9% |
| Immigrants | France | 99.7 /100 | #61 | Exceptional 6.9% |
| Somalis | 99.7 /100 | #62 | Exceptional 6.9% |
| Maltese | 99.7 /100 | #63 | Exceptional 6.9% |
| Tongans | 99.7 /100 | #64 | Exceptional 6.9% |
| Immigrants | Kuwait | 99.7 /100 | #65 | Exceptional 6.9% |
| Immigrants | Belgium | 99.6 /100 | #66 | Exceptional 6.9% |
| Immigrants | Netherlands | 99.5 /100 | #67 | Exceptional 7.0% |
| Paraguayans | 99.4 /100 | #68 | Exceptional 7.0% |
| Immigrants | Eritrea | 99.4 /100 | #69 | Exceptional 7.0% |
| Immigrants | Iraq | 99.4 /100 | #70 | Exceptional 7.0% |
Demographics Similar to Navajo by Unemployment Among Women with Children Under 6 years
In terms of unemployment among women with children under 6 years, the demographic groups most similar to Navajo are Immigrants from Yemen (13.5%, a difference of 0.0%), Pima (13.4%, a difference of 0.40%), Chippewa (13.3%, a difference of 1.2%), Lumbee (13.8%, a difference of 2.2%), and Shoshone (13.2%, a difference of 2.3%).
| Demographics | Rating | Rank | Unemployment Among Women with Children Under 6 years |
| Sioux | 0.0 /100 | #332 | Tragic 11.5% |
| Natives/Alaskans | 0.0 /100 | #333 | Tragic 11.5% |
| Apache | 0.0 /100 | #334 | Tragic 12.3% |
| Puerto Ricans | 0.0 /100 | #335 | Tragic 12.5% |
| Shoshone | 0.0 /100 | #336 | Tragic 13.2% |
| Chippewa | 0.0 /100 | #337 | Tragic 13.3% |
| Pima | 0.0 /100 | #338 | Tragic 13.4% |
| Navajo | 0.0 /100 | #339 | Tragic 13.5% |
| Immigrants | Yemen | 0.0 /100 | #340 | Tragic 13.5% |
| Lumbee | 0.0 /100 | #341 | Tragic 13.8% |
| Yuman | 0.0 /100 | #342 | Tragic 14.6% |
| Crow | 0.0 /100 | #343 | Tragic 14.6% |
| Hopi | 0.0 /100 | #344 | Tragic 16.8% |
| Inupiat | 0.0 /100 | #345 | Tragic 17.7% |
| Arapaho | 0.0 /100 | #346 | Tragic 19.0% |