Swedish vs Latvian Unemployment Among Women with Children Under 6 years
COMPARE
Swedish
Latvian
Unemployment Among Women with Children Under 6 years
Unemployment Among Women with Children Under 6 years Comparison
Swedes
Latvians
7.4%
UNEMPLOYMENT AMONG WOMEN WITH CHILDREN UNDER 6 YEARS
88.4/ 100
METRIC RATING
130th/ 347
METRIC RANK
6.8%
UNEMPLOYMENT AMONG WOMEN WITH CHILDREN UNDER 6 YEARS
99.9/ 100
METRIC RATING
46th/ 347
METRIC RANK
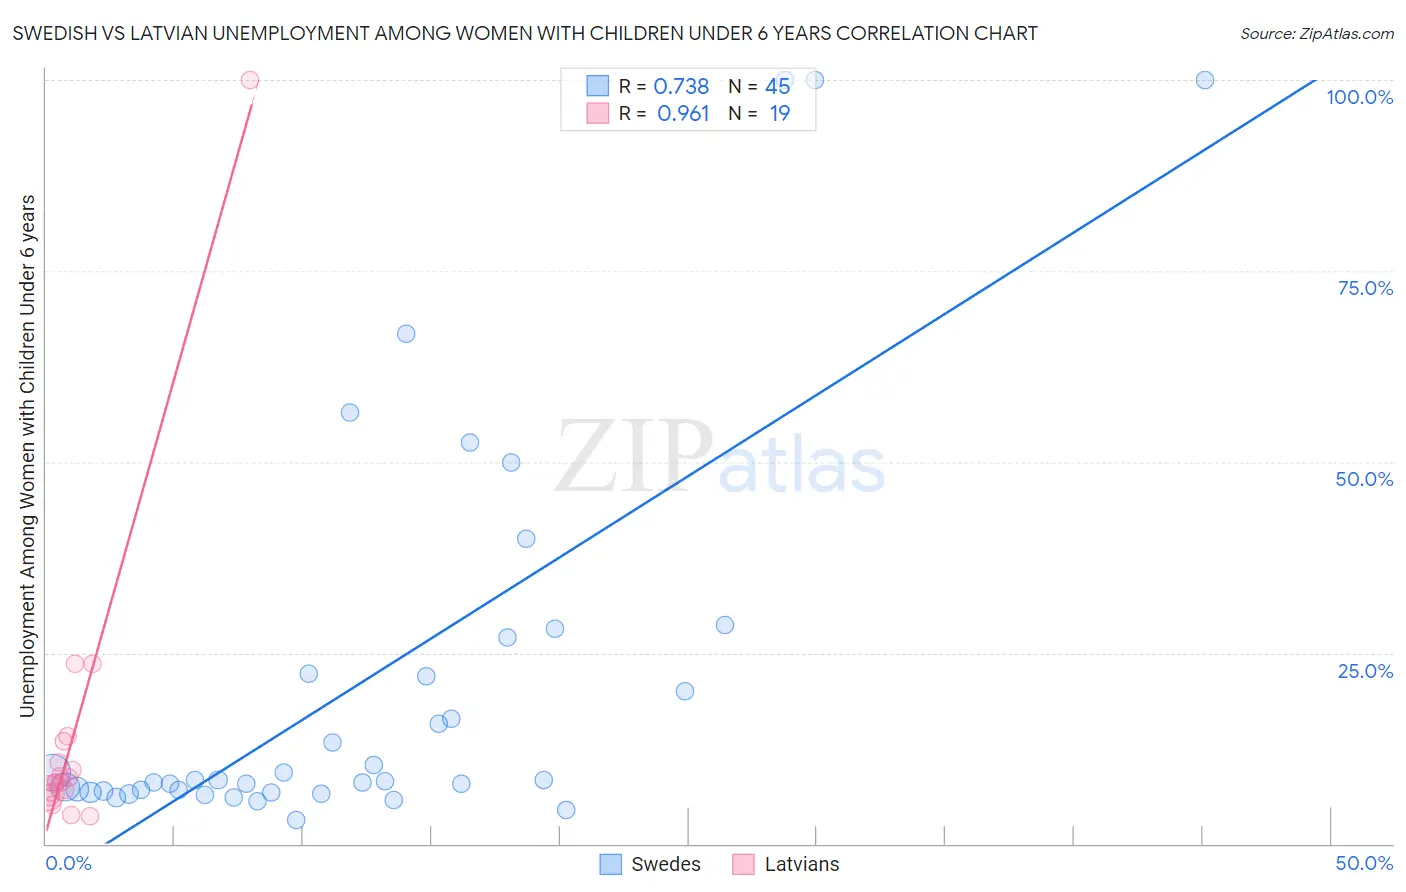
Swedish vs Latvian Unemployment Among Women with Children Under 6 years Correlation Chart
The statistical analysis conducted on geographies consisting of 362,245,772 people shows a strong positive correlation between the proportion of Swedes and unemployment rate among women with children under the age of 6 in the United States with a correlation coefficient (R) of 0.738 and weighted average of 7.4%. Similarly, the statistical analysis conducted on geographies consisting of 177,379,958 people shows a perfect positive correlation between the proportion of Latvians and unemployment rate among women with children under the age of 6 in the United States with a correlation coefficient (R) of 0.961 and weighted average of 6.8%, a difference of 9.2%.
Unemployment Among Women with Children Under 6 years Correlation Summary
| Measurement | Swedish | Latvian |
| Minimum | 3.1% | 3.6% |
| Maximum | 100.0% | 100.0% |
| Range | 96.9% | 96.4% |
| Mean | 21.3% | 14.5% |
| Median | 8.4% | 8.0% |
| Interquartile 25% (IQ1) | 6.8% | 6.7% |
| Interquartile 75% (IQ3) | 24.6% | 13.4% |
| Interquartile Range (IQR) | 17.8% | 6.7% |
| Standard Deviation (Sample) | 26.1% | 21.4% |
| Standard Deviation (Population) | 25.8% | 20.9% |
Similar Demographics by Unemployment Among Women with Children Under 6 years
Demographics Similar to Swedes by Unemployment Among Women with Children Under 6 years
In terms of unemployment among women with children under 6 years, the demographic groups most similar to Swedes are Ukrainian (7.4%, a difference of 0.040%), Slovene (7.4%, a difference of 0.14%), Immigrants from Armenia (7.4%, a difference of 0.17%), Immigrants from Uganda (7.4%, a difference of 0.29%), and Immigrants from Bolivia (7.4%, a difference of 0.40%).
| Demographics | Rating | Rank | Unemployment Among Women with Children Under 6 years |
| Immigrants | Zaire | 93.3 /100 | #123 | Exceptional 7.3% |
| Immigrants | South Africa | 92.5 /100 | #124 | Exceptional 7.3% |
| Pakistanis | 92.2 /100 | #125 | Exceptional 7.3% |
| Immigrants | Burma/Myanmar | 91.9 /100 | #126 | Exceptional 7.3% |
| Jordanians | 91.5 /100 | #127 | Exceptional 7.3% |
| Zimbabweans | 91.5 /100 | #128 | Exceptional 7.3% |
| Slovenes | 89.2 /100 | #129 | Excellent 7.4% |
| Swedes | 88.4 /100 | #130 | Excellent 7.4% |
| Ukrainians | 88.2 /100 | #131 | Excellent 7.4% |
| Immigrants | Armenia | 87.4 /100 | #132 | Excellent 7.4% |
| Immigrants | Uganda | 86.5 /100 | #133 | Excellent 7.4% |
| Immigrants | Bolivia | 85.7 /100 | #134 | Excellent 7.4% |
| Immigrants | Northern Africa | 85.3 /100 | #135 | Excellent 7.4% |
| Immigrants | Morocco | 84.9 /100 | #136 | Excellent 7.4% |
| Immigrants | Cambodia | 84.6 /100 | #137 | Excellent 7.4% |
Demographics Similar to Latvians by Unemployment Among Women with Children Under 6 years
In terms of unemployment among women with children under 6 years, the demographic groups most similar to Latvians are Immigrants from Asia (6.8%, a difference of 0.17%), Immigrants from Switzerland (6.8%, a difference of 0.20%), Immigrants from Australia (6.8%, a difference of 0.24%), Immigrants from Nepal (6.8%, a difference of 0.26%), and Immigrants from Ireland (6.8%, a difference of 0.26%).
| Demographics | Rating | Rank | Unemployment Among Women with Children Under 6 years |
| Immigrants | Russia | 100.0 /100 | #39 | Exceptional 6.7% |
| Asians | 100.0 /100 | #40 | Exceptional 6.7% |
| Immigrants | Indonesia | 99.9 /100 | #41 | Exceptional 6.7% |
| Immigrants | Cuba | 99.9 /100 | #42 | Exceptional 6.7% |
| Bhutanese | 99.9 /100 | #43 | Exceptional 6.7% |
| Iranians | 99.9 /100 | #44 | Exceptional 6.7% |
| Immigrants | Australia | 99.9 /100 | #45 | Exceptional 6.8% |
| Latvians | 99.9 /100 | #46 | Exceptional 6.8% |
| Immigrants | Asia | 99.9 /100 | #47 | Exceptional 6.8% |
| Immigrants | Switzerland | 99.9 /100 | #48 | Exceptional 6.8% |
| Immigrants | Nepal | 99.9 /100 | #49 | Exceptional 6.8% |
| Immigrants | Ireland | 99.9 /100 | #50 | Exceptional 6.8% |
| Ethiopians | 99.9 /100 | #51 | Exceptional 6.8% |
| Immigrants | Iran | 99.9 /100 | #52 | Exceptional 6.8% |
| Chinese | 99.9 /100 | #53 | Exceptional 6.8% |