Thai vs Sri Lankan Unemployment Among Women with Children Ages 6 to 17 years
COMPARE
Thai
Sri Lankan
Unemployment Among Women with Children Ages 6 to 17 years
Unemployment Among Women with Children Ages 6 to 17 years Comparison
Thais
Sri Lankans
7.8%
UNEMPLOYMENT AMONG WOMEN WITH CHILDREN AGES 6 TO 17 YEARS
100.0/ 100
METRIC RATING
29th/ 347
METRIC RANK
8.5%
UNEMPLOYMENT AMONG WOMEN WITH CHILDREN AGES 6 TO 17 YEARS
98.7/ 100
METRIC RATING
95th/ 347
METRIC RANK
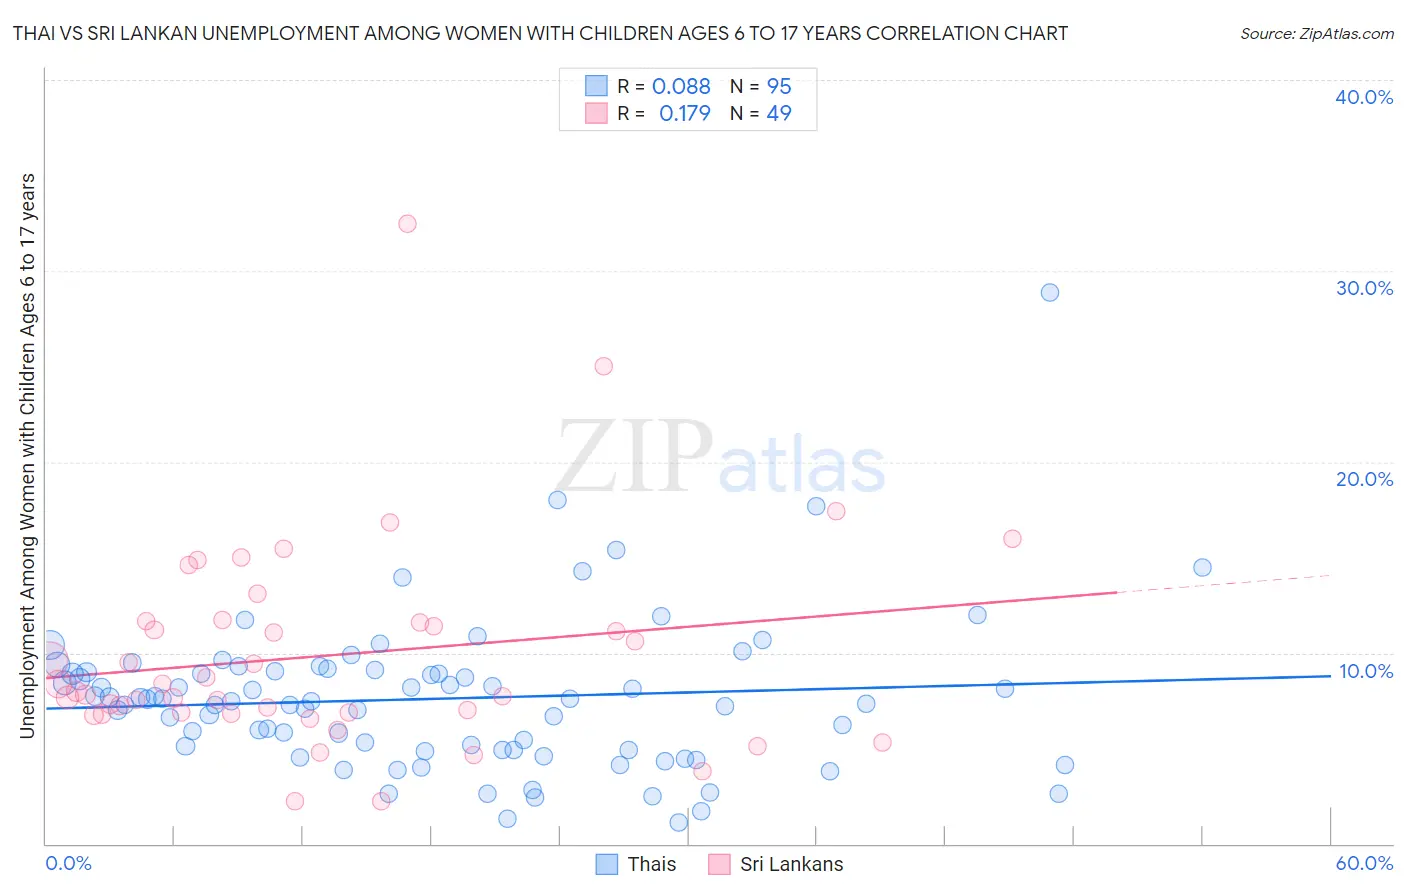
Thai vs Sri Lankan Unemployment Among Women with Children Ages 6 to 17 years Correlation Chart
The statistical analysis conducted on geographies consisting of 328,573,695 people shows a slight positive correlation between the proportion of Thais and unemployment rate among women with children between the ages 6 and 17 in the United States with a correlation coefficient (R) of 0.088 and weighted average of 7.8%. Similarly, the statistical analysis conducted on geographies consisting of 312,508,075 people shows a poor positive correlation between the proportion of Sri Lankans and unemployment rate among women with children between the ages 6 and 17 in the United States with a correlation coefficient (R) of 0.179 and weighted average of 8.5%, a difference of 9.0%.
Unemployment Among Women with Children Ages 6 to 17 years Correlation Summary
| Measurement | Thai | Sri Lankan |
| Minimum | 1.1% | 2.2% |
| Maximum | 28.9% | 32.5% |
| Range | 27.8% | 30.3% |
| Mean | 7.6% | 9.8% |
| Median | 7.5% | 8.0% |
| Interquartile 25% (IQ1) | 4.9% | 6.8% |
| Interquartile 75% (IQ3) | 9.0% | 11.6% |
| Interquartile Range (IQR) | 4.1% | 4.8% |
| Standard Deviation (Sample) | 4.0% | 5.4% |
| Standard Deviation (Population) | 4.0% | 5.4% |
Similar Demographics by Unemployment Among Women with Children Ages 6 to 17 years
Demographics Similar to Thais by Unemployment Among Women with Children Ages 6 to 17 years
In terms of unemployment among women with children ages 6 to 17 years, the demographic groups most similar to Thais are Immigrants from Uzbekistan (7.8%, a difference of 0.34%), Immigrants from Afghanistan (7.8%, a difference of 0.67%), Immigrants from Iran (7.9%, a difference of 0.89%), Laotian (7.9%, a difference of 1.1%), and Immigrants from Cambodia (7.9%, a difference of 1.1%).
| Demographics | Rating | Rank | Unemployment Among Women with Children Ages 6 to 17 years |
| Immigrants | China | 100.0 /100 | #22 | Exceptional 7.7% |
| Immigrants | Indonesia | 100.0 /100 | #23 | Exceptional 7.7% |
| Nepalese | 100.0 /100 | #24 | Exceptional 7.7% |
| Immigrants | Eastern Asia | 100.0 /100 | #25 | Exceptional 7.7% |
| Indians (Asian) | 100.0 /100 | #26 | Exceptional 7.7% |
| Immigrants | Afghanistan | 100.0 /100 | #27 | Exceptional 7.8% |
| Immigrants | Uzbekistan | 100.0 /100 | #28 | Exceptional 7.8% |
| Thais | 100.0 /100 | #29 | Exceptional 7.8% |
| Immigrants | Iran | 100.0 /100 | #30 | Exceptional 7.9% |
| Laotians | 100.0 /100 | #31 | Exceptional 7.9% |
| Immigrants | Cambodia | 100.0 /100 | #32 | Exceptional 7.9% |
| Immigrants | Korea | 100.0 /100 | #33 | Exceptional 7.9% |
| Native Hawaiians | 100.0 /100 | #34 | Exceptional 7.9% |
| Immigrants | South Central Asia | 100.0 /100 | #35 | Exceptional 7.9% |
| Burmese | 100.0 /100 | #36 | Exceptional 8.0% |
Demographics Similar to Sri Lankans by Unemployment Among Women with Children Ages 6 to 17 years
In terms of unemployment among women with children ages 6 to 17 years, the demographic groups most similar to Sri Lankans are Immigrants from Barbados (8.5%, a difference of 0.060%), German Russian (8.5%, a difference of 0.070%), Bolivian (8.5%, a difference of 0.15%), Australian (8.5%, a difference of 0.16%), and Malaysian (8.6%, a difference of 0.20%).
| Demographics | Rating | Rank | Unemployment Among Women with Children Ages 6 to 17 years |
| Immigrants | Vietnam | 99.1 /100 | #88 | Exceptional 8.5% |
| Paiute | 99.1 /100 | #89 | Exceptional 8.5% |
| Yugoslavians | 99.0 /100 | #90 | Exceptional 8.5% |
| Immigrants | Eastern Europe | 99.0 /100 | #91 | Exceptional 8.5% |
| Potawatomi | 99.0 /100 | #92 | Exceptional 8.5% |
| Australians | 98.9 /100 | #93 | Exceptional 8.5% |
| Immigrants | Barbados | 98.8 /100 | #94 | Exceptional 8.5% |
| Sri Lankans | 98.7 /100 | #95 | Exceptional 8.5% |
| German Russians | 98.6 /100 | #96 | Exceptional 8.5% |
| Bolivians | 98.5 /100 | #97 | Exceptional 8.5% |
| Malaysians | 98.5 /100 | #98 | Exceptional 8.6% |
| Immigrants | Lithuania | 98.4 /100 | #99 | Exceptional 8.6% |
| New Zealanders | 98.4 /100 | #100 | Exceptional 8.6% |
| Immigrants | Pakistan | 98.4 /100 | #101 | Exceptional 8.6% |
| Immigrants | South Africa | 98.3 /100 | #102 | Exceptional 8.6% |