Ute vs Sri Lankan Unemployment Among Women with Children Ages 6 to 17 years
COMPARE
Ute
Sri Lankan
Unemployment Among Women with Children Ages 6 to 17 years
Unemployment Among Women with Children Ages 6 to 17 years Comparison
Ute
Sri Lankans
7.0%
UNEMPLOYMENT AMONG WOMEN WITH CHILDREN AGES 6 TO 17 YEARS
100.0/ 100
METRIC RATING
4th/ 347
METRIC RANK
8.5%
UNEMPLOYMENT AMONG WOMEN WITH CHILDREN AGES 6 TO 17 YEARS
98.7/ 100
METRIC RATING
95th/ 347
METRIC RANK
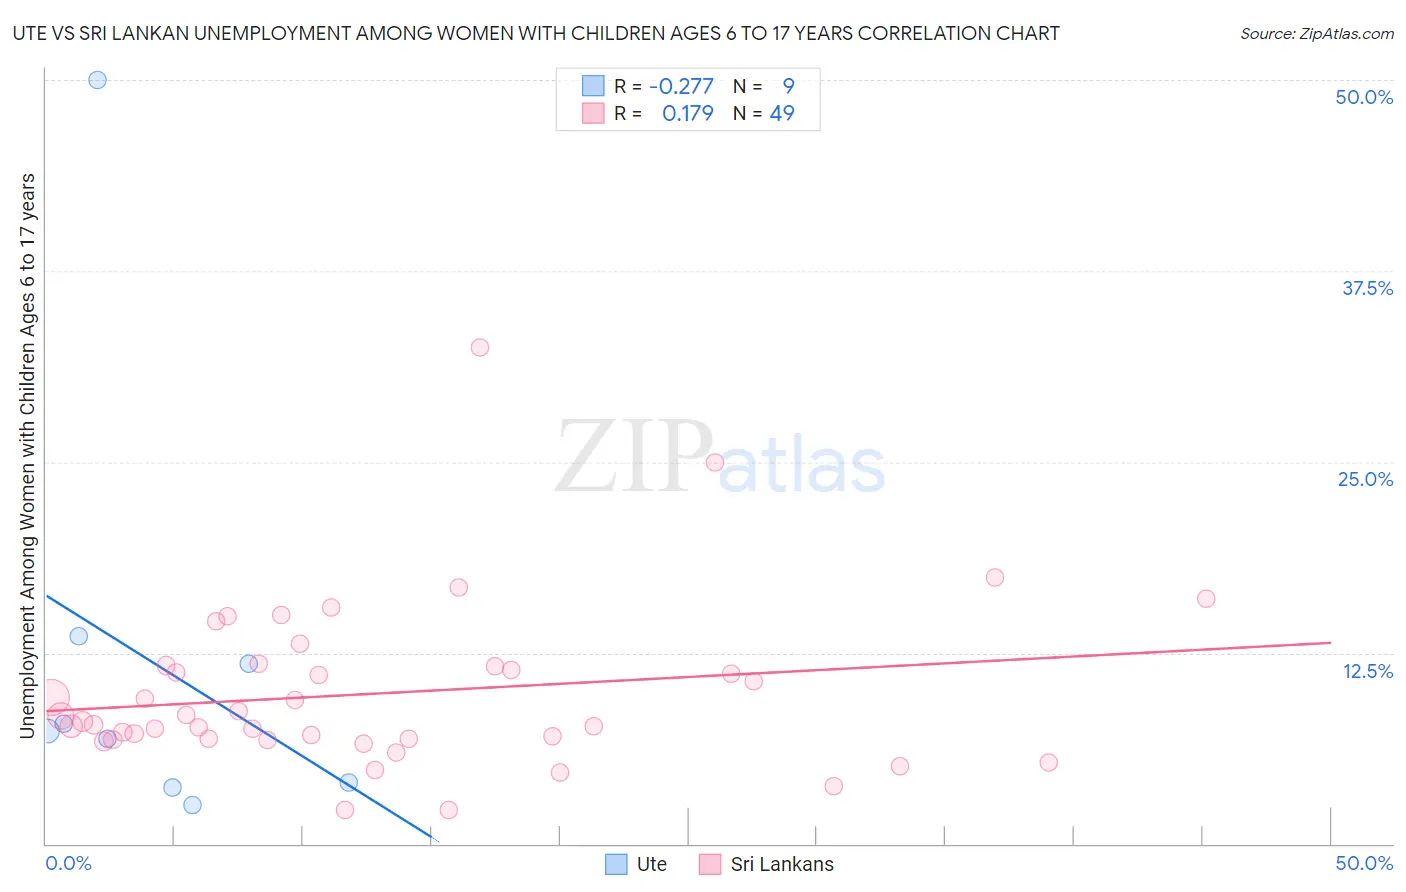
Ute vs Sri Lankan Unemployment Among Women with Children Ages 6 to 17 years Correlation Chart
The statistical analysis conducted on geographies consisting of 50,489,522 people shows a weak negative correlation between the proportion of Ute and unemployment rate among women with children between the ages 6 and 17 in the United States with a correlation coefficient (R) of -0.277 and weighted average of 7.0%. Similarly, the statistical analysis conducted on geographies consisting of 312,508,075 people shows a poor positive correlation between the proportion of Sri Lankans and unemployment rate among women with children between the ages 6 and 17 in the United States with a correlation coefficient (R) of 0.179 and weighted average of 8.5%, a difference of 21.8%.
Unemployment Among Women with Children Ages 6 to 17 years Correlation Summary
| Measurement | Ute | Sri Lankan |
| Minimum | 2.5% | 2.2% |
| Maximum | 50.0% | 32.5% |
| Range | 47.5% | 30.3% |
| Mean | 12.0% | 9.8% |
| Median | 7.4% | 8.0% |
| Interquartile 25% (IQ1) | 3.8% | 6.8% |
| Interquartile 75% (IQ3) | 12.7% | 11.6% |
| Interquartile Range (IQR) | 8.8% | 4.8% |
| Standard Deviation (Sample) | 14.7% | 5.4% |
| Standard Deviation (Population) | 13.9% | 5.4% |
Similar Demographics by Unemployment Among Women with Children Ages 6 to 17 years
Demographics Similar to Ute by Unemployment Among Women with Children Ages 6 to 17 years
In terms of unemployment among women with children ages 6 to 17 years, the demographic groups most similar to Ute are Okinawan (7.0%, a difference of 0.60%), Tlingit-Haida (7.1%, a difference of 1.1%), Soviet Union (7.1%, a difference of 1.1%), Immigrants from Hong Kong (7.2%, a difference of 2.6%), and Assyrian/Chaldean/Syriac (7.2%, a difference of 2.9%).
| Demographics | Rating | Rank | Unemployment Among Women with Children Ages 6 to 17 years |
| Taiwanese | 100.0 /100 | #1 | Exceptional 6.5% |
| Fijians | 100.0 /100 | #2 | Exceptional 6.6% |
| Tongans | 100.0 /100 | #3 | Exceptional 6.7% |
| Ute | 100.0 /100 | #4 | Exceptional 7.0% |
| Okinawans | 100.0 /100 | #5 | Exceptional 7.0% |
| Tlingit-Haida | 100.0 /100 | #6 | Exceptional 7.1% |
| Soviet Union | 100.0 /100 | #7 | Exceptional 7.1% |
| Immigrants | Hong Kong | 100.0 /100 | #8 | Exceptional 7.2% |
| Assyrians/Chaldeans/Syriacs | 100.0 /100 | #9 | Exceptional 7.2% |
| Immigrants | Fiji | 100.0 /100 | #10 | Exceptional 7.3% |
| Immigrants | Taiwan | 100.0 /100 | #11 | Exceptional 7.3% |
| Bangladeshis | 100.0 /100 | #12 | Exceptional 7.4% |
| Indonesians | 100.0 /100 | #13 | Exceptional 7.4% |
| Sudanese | 100.0 /100 | #14 | Exceptional 7.4% |
| Puget Sound Salish | 100.0 /100 | #15 | Exceptional 7.5% |
Demographics Similar to Sri Lankans by Unemployment Among Women with Children Ages 6 to 17 years
In terms of unemployment among women with children ages 6 to 17 years, the demographic groups most similar to Sri Lankans are Immigrants from Barbados (8.5%, a difference of 0.060%), German Russian (8.5%, a difference of 0.070%), Bolivian (8.5%, a difference of 0.15%), Australian (8.5%, a difference of 0.16%), and Malaysian (8.6%, a difference of 0.20%).
| Demographics | Rating | Rank | Unemployment Among Women with Children Ages 6 to 17 years |
| Immigrants | Vietnam | 99.1 /100 | #88 | Exceptional 8.5% |
| Paiute | 99.1 /100 | #89 | Exceptional 8.5% |
| Yugoslavians | 99.0 /100 | #90 | Exceptional 8.5% |
| Immigrants | Eastern Europe | 99.0 /100 | #91 | Exceptional 8.5% |
| Potawatomi | 99.0 /100 | #92 | Exceptional 8.5% |
| Australians | 98.9 /100 | #93 | Exceptional 8.5% |
| Immigrants | Barbados | 98.8 /100 | #94 | Exceptional 8.5% |
| Sri Lankans | 98.7 /100 | #95 | Exceptional 8.5% |
| German Russians | 98.6 /100 | #96 | Exceptional 8.5% |
| Bolivians | 98.5 /100 | #97 | Exceptional 8.5% |
| Malaysians | 98.5 /100 | #98 | Exceptional 8.6% |
| Immigrants | Lithuania | 98.4 /100 | #99 | Exceptional 8.6% |
| New Zealanders | 98.4 /100 | #100 | Exceptional 8.6% |
| Immigrants | Pakistan | 98.4 /100 | #101 | Exceptional 8.6% |
| Immigrants | South Africa | 98.3 /100 | #102 | Exceptional 8.6% |