Spaniard vs Jamaican Unemployment Among Women with Children Under 6 years
COMPARE
Spaniard
Jamaican
Unemployment Among Women with Children Under 6 years
Unemployment Among Women with Children Under 6 years Comparison
Spaniards
Jamaicans
7.8%
UNEMPLOYMENT AMONG WOMEN WITH CHILDREN UNDER 6 YEARS
23.3/ 100
METRIC RATING
203rd/ 347
METRIC RANK
8.8%
UNEMPLOYMENT AMONG WOMEN WITH CHILDREN UNDER 6 YEARS
0.0/ 100
METRIC RATING
291st/ 347
METRIC RANK
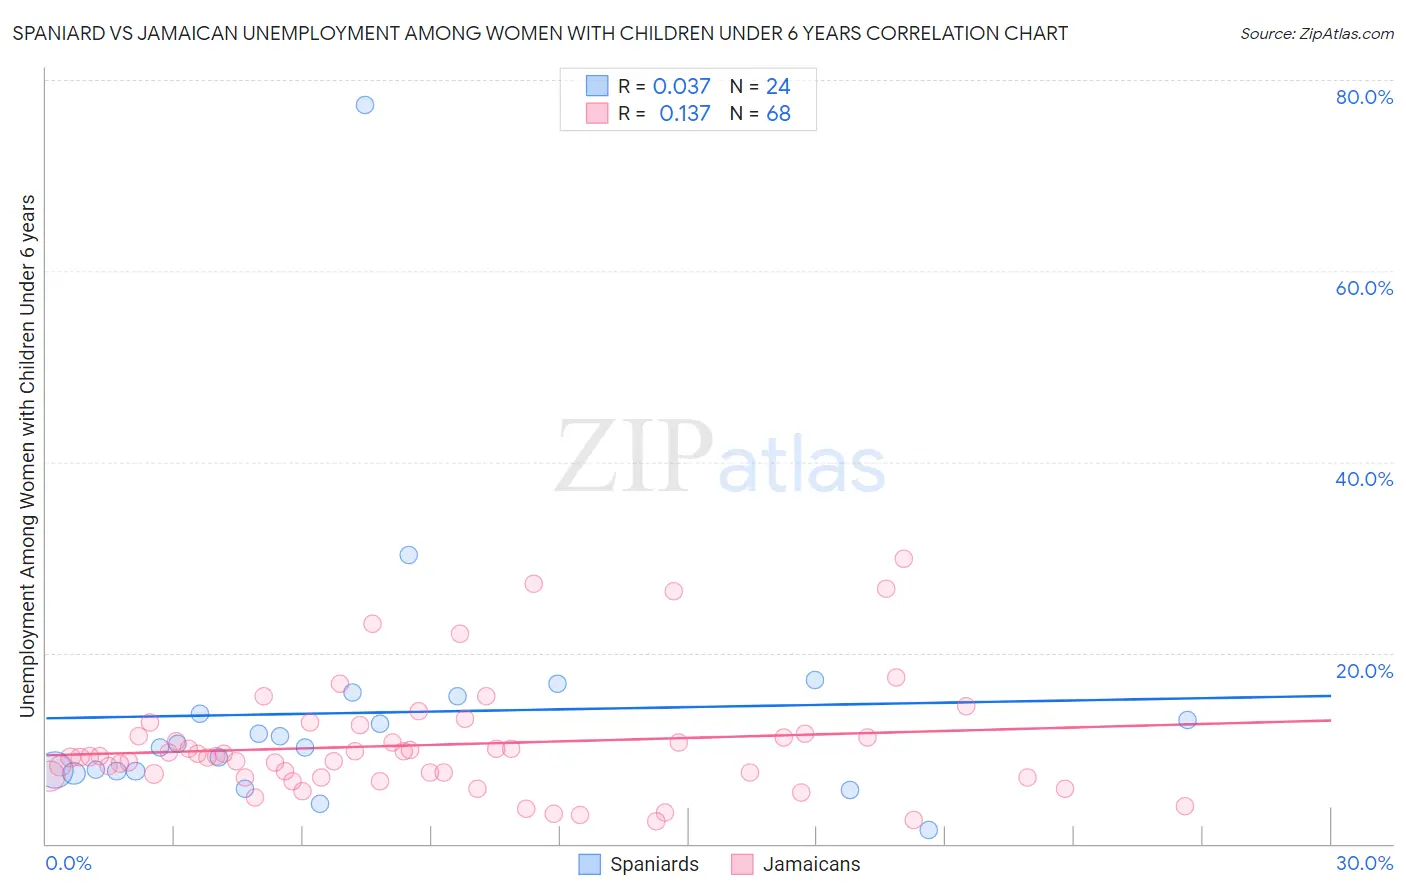
Spaniard vs Jamaican Unemployment Among Women with Children Under 6 years Correlation Chart
The statistical analysis conducted on geographies consisting of 330,047,917 people shows no correlation between the proportion of Spaniards and unemployment rate among women with children under the age of 6 in the United States with a correlation coefficient (R) of 0.037 and weighted average of 7.8%. Similarly, the statistical analysis conducted on geographies consisting of 287,606,007 people shows a poor positive correlation between the proportion of Jamaicans and unemployment rate among women with children under the age of 6 in the United States with a correlation coefficient (R) of 0.137 and weighted average of 8.8%, a difference of 12.8%.
Unemployment Among Women with Children Under 6 years Correlation Summary
| Measurement | Spaniard | Jamaican |
| Minimum | 1.5% | 2.3% |
| Maximum | 77.4% | 29.8% |
| Range | 75.9% | 27.5% |
| Mean | 13.7% | 10.4% |
| Median | 10.3% | 9.1% |
| Interquartile 25% (IQ1) | 7.6% | 7.1% |
| Interquartile 75% (IQ3) | 14.5% | 11.4% |
| Interquartile Range (IQR) | 6.9% | 4.3% |
| Standard Deviation (Sample) | 14.7% | 5.9% |
| Standard Deviation (Population) | 14.4% | 5.8% |
Similar Demographics by Unemployment Among Women with Children Under 6 years
Demographics Similar to Spaniards by Unemployment Among Women with Children Under 6 years
In terms of unemployment among women with children under 6 years, the demographic groups most similar to Spaniards are Sudanese (7.8%, a difference of 0.010%), Lebanese (7.8%, a difference of 0.11%), Basque (7.8%, a difference of 0.12%), Immigrants (7.8%, a difference of 0.18%), and Guamanian/Chamorro (7.8%, a difference of 0.19%).
| Demographics | Rating | Rank | Unemployment Among Women with Children Under 6 years |
| Immigrants | St. Vincent and the Grenadines | 31.1 /100 | #196 | Fair 7.7% |
| Italians | 30.4 /100 | #197 | Fair 7.7% |
| Lithuanians | 30.0 /100 | #198 | Fair 7.8% |
| Immigrants | Poland | 27.3 /100 | #199 | Fair 7.8% |
| Guamanians/Chamorros | 25.5 /100 | #200 | Fair 7.8% |
| Basques | 24.7 /100 | #201 | Fair 7.8% |
| Sudanese | 23.5 /100 | #202 | Fair 7.8% |
| Spaniards | 23.3 /100 | #203 | Fair 7.8% |
| Lebanese | 22.2 /100 | #204 | Fair 7.8% |
| Immigrants | Immigrants | 21.4 /100 | #205 | Fair 7.8% |
| Hungarians | 21.2 /100 | #206 | Fair 7.8% |
| Canadians | 20.6 /100 | #207 | Fair 7.8% |
| Immigrants | Syria | 18.9 /100 | #208 | Poor 7.8% |
| Costa Ricans | 17.6 /100 | #209 | Poor 7.8% |
| Poles | 16.0 /100 | #210 | Poor 7.9% |
Demographics Similar to Jamaicans by Unemployment Among Women with Children Under 6 years
In terms of unemployment among women with children under 6 years, the demographic groups most similar to Jamaicans are Cheyenne (8.8%, a difference of 0.25%), Vietnamese (8.8%, a difference of 0.44%), Immigrants from Bangladesh (8.8%, a difference of 0.48%), Iroquois (8.7%, a difference of 0.59%), and Nonimmigrants (8.8%, a difference of 0.67%).
| Demographics | Rating | Rank | Unemployment Among Women with Children Under 6 years |
| Blackfeet | 0.0 /100 | #284 | Tragic 8.7% |
| U.S. Virgin Islanders | 0.0 /100 | #285 | Tragic 8.7% |
| Seminole | 0.0 /100 | #286 | Tragic 8.7% |
| Menominee | 0.0 /100 | #287 | Tragic 8.7% |
| Bahamians | 0.0 /100 | #288 | Tragic 8.7% |
| Iroquois | 0.0 /100 | #289 | Tragic 8.7% |
| Vietnamese | 0.0 /100 | #290 | Tragic 8.8% |
| Jamaicans | 0.0 /100 | #291 | Tragic 8.8% |
| Cheyenne | 0.0 /100 | #292 | Tragic 8.8% |
| Immigrants | Bangladesh | 0.0 /100 | #293 | Tragic 8.8% |
| Immigrants | Nonimmigrants | 0.0 /100 | #294 | Tragic 8.8% |
| Immigrants | Central America | 0.0 /100 | #295 | Tragic 8.9% |
| Immigrants | Dominican Republic | 0.0 /100 | #296 | Tragic 8.9% |
| Mexicans | 0.0 /100 | #297 | Tragic 8.9% |
| Tlingit-Haida | 0.0 /100 | #298 | Tragic 8.9% |