Spaniard vs Sierra Leonean Unemployment Among Women with Children Under 6 years
COMPARE
Spaniard
Sierra Leonean
Unemployment Among Women with Children Under 6 years
Unemployment Among Women with Children Under 6 years Comparison
Spaniards
Sierra Leoneans
7.8%
UNEMPLOYMENT AMONG WOMEN WITH CHILDREN UNDER 6 YEARS
23.3/ 100
METRIC RATING
203rd/ 347
METRIC RANK
7.7%
UNEMPLOYMENT AMONG WOMEN WITH CHILDREN UNDER 6 YEARS
42.9/ 100
METRIC RATING
183rd/ 347
METRIC RANK
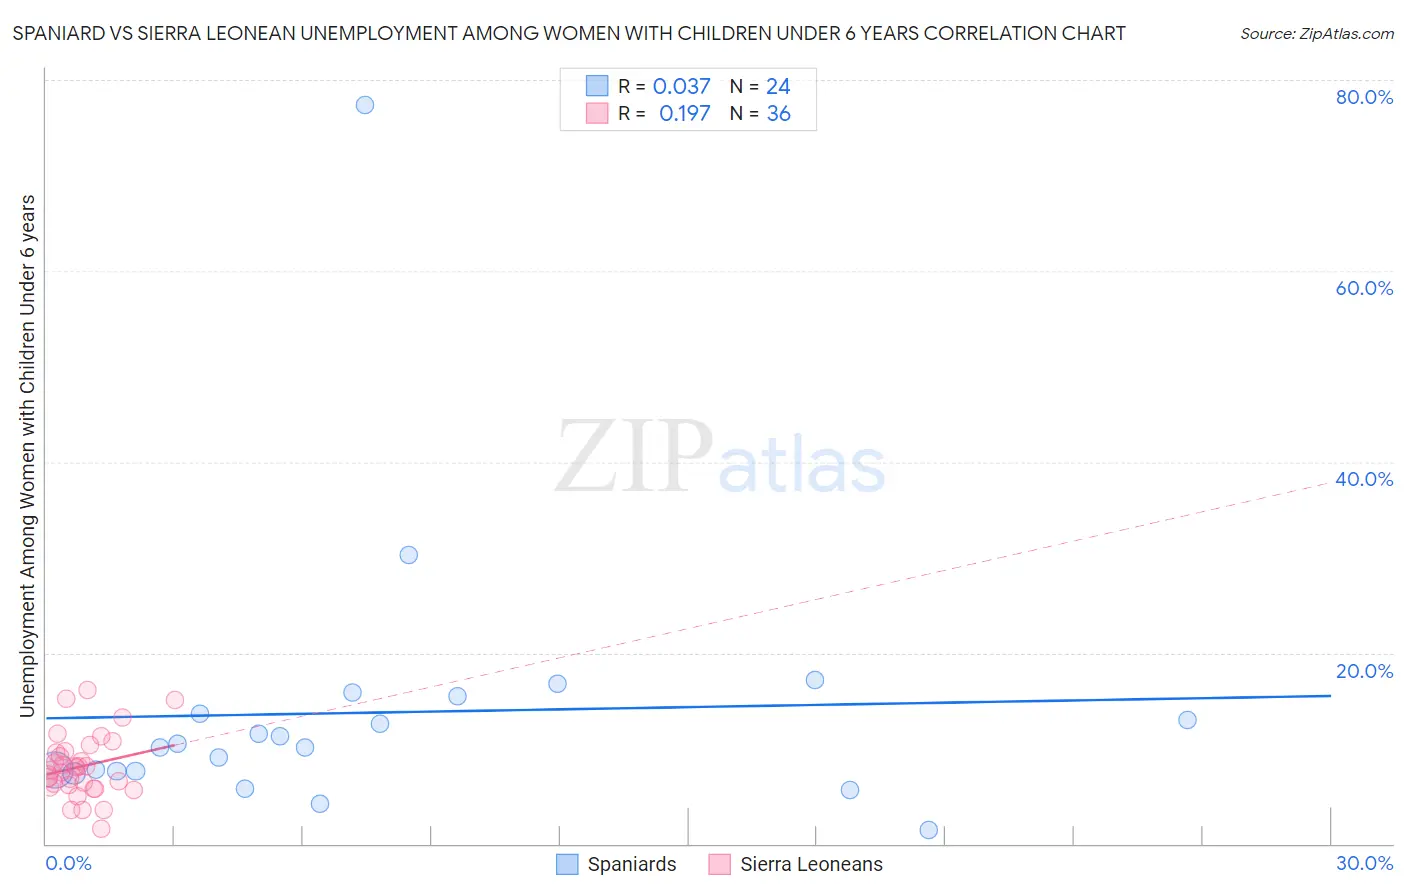
Spaniard vs Sierra Leonean Unemployment Among Women with Children Under 6 years Correlation Chart
The statistical analysis conducted on geographies consisting of 330,047,917 people shows no correlation between the proportion of Spaniards and unemployment rate among women with children under the age of 6 in the United States with a correlation coefficient (R) of 0.037 and weighted average of 7.8%. Similarly, the statistical analysis conducted on geographies consisting of 77,390,679 people shows a poor positive correlation between the proportion of Sierra Leoneans and unemployment rate among women with children under the age of 6 in the United States with a correlation coefficient (R) of 0.197 and weighted average of 7.7%, a difference of 1.5%.
Unemployment Among Women with Children Under 6 years Correlation Summary
| Measurement | Spaniard | Sierra Leonean |
| Minimum | 1.5% | 1.6% |
| Maximum | 77.4% | 16.1% |
| Range | 75.9% | 14.5% |
| Mean | 13.7% | 8.1% |
| Median | 10.3% | 7.8% |
| Interquartile 25% (IQ1) | 7.6% | 6.0% |
| Interquartile 75% (IQ3) | 14.5% | 9.6% |
| Interquartile Range (IQR) | 6.9% | 3.6% |
| Standard Deviation (Sample) | 14.7% | 3.3% |
| Standard Deviation (Population) | 14.4% | 3.3% |
Demographics Similar to Spaniards and Sierra Leoneans by Unemployment Among Women with Children Under 6 years
In terms of unemployment among women with children under 6 years, the demographic groups most similar to Spaniards are Sudanese (7.8%, a difference of 0.010%), Basque (7.8%, a difference of 0.12%), Guamanian/Chamorro (7.8%, a difference of 0.19%), Immigrants from Poland (7.8%, a difference of 0.34%), and Lithuanian (7.8%, a difference of 0.56%). Similarly, the demographic groups most similar to Sierra Leoneans are Indonesian (7.7%, a difference of 0.16%), Spanish American (7.7%, a difference of 0.22%), Yugoslavian (7.7%, a difference of 0.24%), Immigrants from Thailand (7.7%, a difference of 0.30%), and Czechoslovakian (7.7%, a difference of 0.30%).
| Demographics | Rating | Rank | Unemployment Among Women with Children Under 6 years |
| Sierra Leoneans | 42.9 /100 | #183 | Average 7.7% |
| Indonesians | 40.5 /100 | #184 | Average 7.7% |
| Spanish Americans | 39.7 /100 | #185 | Fair 7.7% |
| Yugoslavians | 39.4 /100 | #186 | Fair 7.7% |
| Immigrants | Thailand | 38.5 /100 | #187 | Fair 7.7% |
| Czechoslovakians | 38.4 /100 | #188 | Fair 7.7% |
| Immigrants | Panama | 35.7 /100 | #189 | Fair 7.7% |
| Immigrants | North Macedonia | 34.4 /100 | #190 | Fair 7.7% |
| Immigrants | Austria | 32.4 /100 | #191 | Fair 7.7% |
| Immigrants | Africa | 32.4 /100 | #192 | Fair 7.7% |
| Slavs | 32.4 /100 | #193 | Fair 7.7% |
| Syrians | 31.9 /100 | #194 | Fair 7.7% |
| Malaysians | 31.1 /100 | #195 | Fair 7.7% |
| Immigrants | St. Vincent and the Grenadines | 31.1 /100 | #196 | Fair 7.7% |
| Italians | 30.4 /100 | #197 | Fair 7.7% |
| Lithuanians | 30.0 /100 | #198 | Fair 7.8% |
| Immigrants | Poland | 27.3 /100 | #199 | Fair 7.8% |
| Guamanians/Chamorros | 25.5 /100 | #200 | Fair 7.8% |
| Basques | 24.7 /100 | #201 | Fair 7.8% |
| Sudanese | 23.5 /100 | #202 | Fair 7.8% |
| Spaniards | 23.3 /100 | #203 | Fair 7.8% |