Spaniard vs Serbian Unemployment Among Women with Children Under 6 years
COMPARE
Spaniard
Serbian
Unemployment Among Women with Children Under 6 years
Unemployment Among Women with Children Under 6 years Comparison
Spaniards
Serbians
7.8%
UNEMPLOYMENT AMONG WOMEN WITH CHILDREN UNDER 6 YEARS
23.3/ 100
METRIC RATING
203rd/ 347
METRIC RANK
7.3%
UNEMPLOYMENT AMONG WOMEN WITH CHILDREN UNDER 6 YEARS
94.5/ 100
METRIC RATING
118th/ 347
METRIC RANK
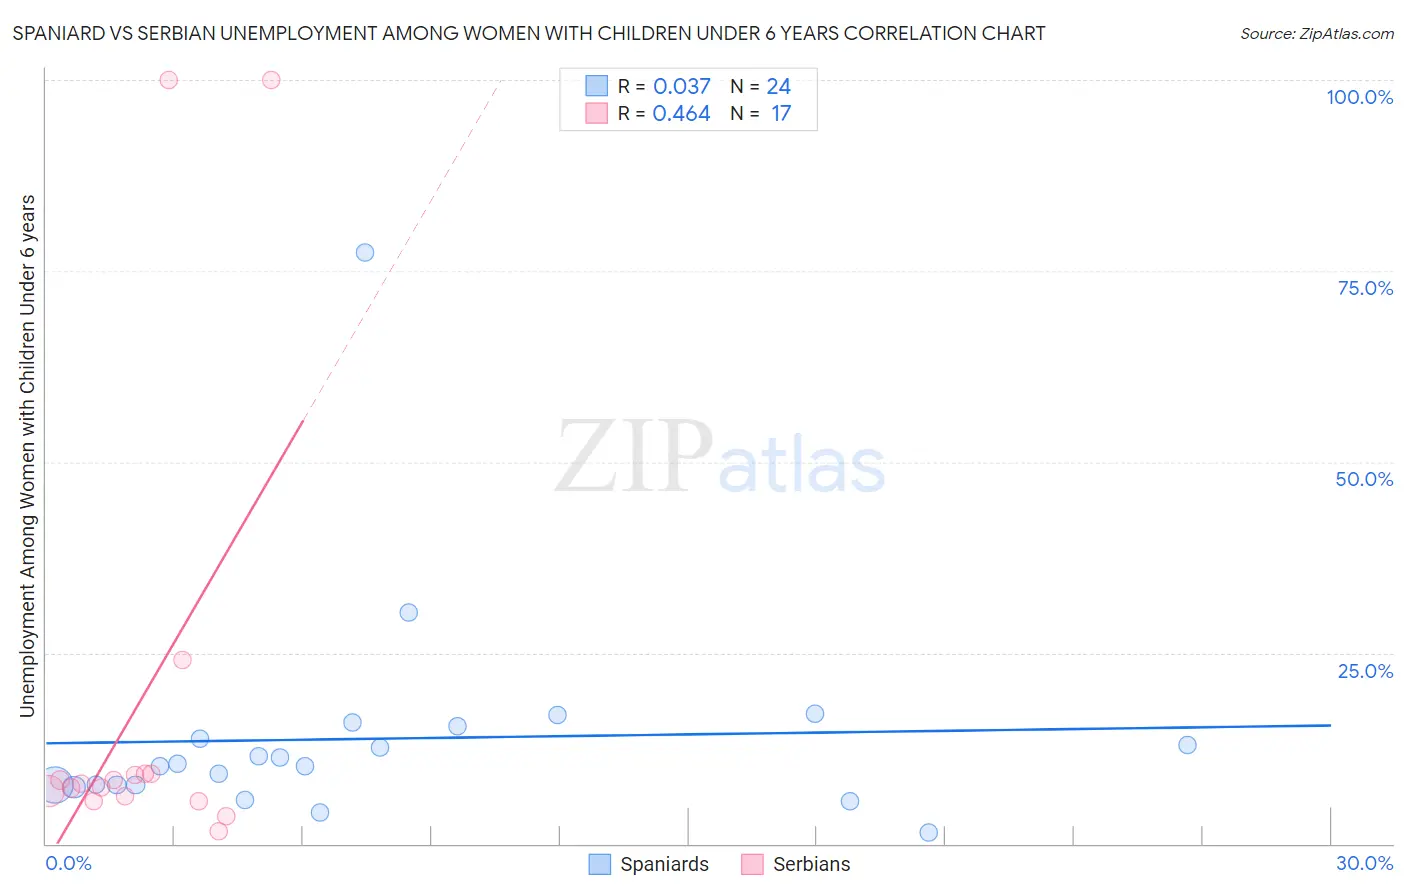
Spaniard vs Serbian Unemployment Among Women with Children Under 6 years Correlation Chart
The statistical analysis conducted on geographies consisting of 330,047,917 people shows no correlation between the proportion of Spaniards and unemployment rate among women with children under the age of 6 in the United States with a correlation coefficient (R) of 0.037 and weighted average of 7.8%. Similarly, the statistical analysis conducted on geographies consisting of 212,728,717 people shows a moderate positive correlation between the proportion of Serbians and unemployment rate among women with children under the age of 6 in the United States with a correlation coefficient (R) of 0.464 and weighted average of 7.3%, a difference of 7.0%.
Unemployment Among Women with Children Under 6 years Correlation Summary
| Measurement | Spaniard | Serbian |
| Minimum | 1.5% | 1.6% |
| Maximum | 77.4% | 100.0% |
| Range | 75.9% | 98.4% |
| Mean | 13.7% | 18.8% |
| Median | 10.3% | 7.9% |
| Interquartile 25% (IQ1) | 7.6% | 5.9% |
| Interquartile 75% (IQ3) | 14.5% | 9.1% |
| Interquartile Range (IQR) | 6.9% | 3.2% |
| Standard Deviation (Sample) | 14.7% | 30.9% |
| Standard Deviation (Population) | 14.4% | 30.0% |
Similar Demographics by Unemployment Among Women with Children Under 6 years
Demographics Similar to Spaniards by Unemployment Among Women with Children Under 6 years
In terms of unemployment among women with children under 6 years, the demographic groups most similar to Spaniards are Sudanese (7.8%, a difference of 0.010%), Lebanese (7.8%, a difference of 0.11%), Basque (7.8%, a difference of 0.12%), Immigrants (7.8%, a difference of 0.18%), and Guamanian/Chamorro (7.8%, a difference of 0.19%).
| Demographics | Rating | Rank | Unemployment Among Women with Children Under 6 years |
| Immigrants | St. Vincent and the Grenadines | 31.1 /100 | #196 | Fair 7.7% |
| Italians | 30.4 /100 | #197 | Fair 7.7% |
| Lithuanians | 30.0 /100 | #198 | Fair 7.8% |
| Immigrants | Poland | 27.3 /100 | #199 | Fair 7.8% |
| Guamanians/Chamorros | 25.5 /100 | #200 | Fair 7.8% |
| Basques | 24.7 /100 | #201 | Fair 7.8% |
| Sudanese | 23.5 /100 | #202 | Fair 7.8% |
| Spaniards | 23.3 /100 | #203 | Fair 7.8% |
| Lebanese | 22.2 /100 | #204 | Fair 7.8% |
| Immigrants | Immigrants | 21.4 /100 | #205 | Fair 7.8% |
| Hungarians | 21.2 /100 | #206 | Fair 7.8% |
| Canadians | 20.6 /100 | #207 | Fair 7.8% |
| Immigrants | Syria | 18.9 /100 | #208 | Poor 7.8% |
| Costa Ricans | 17.6 /100 | #209 | Poor 7.8% |
| Poles | 16.0 /100 | #210 | Poor 7.9% |
Demographics Similar to Serbians by Unemployment Among Women with Children Under 6 years
In terms of unemployment among women with children under 6 years, the demographic groups most similar to Serbians are South African (7.3%, a difference of 0.11%), Iraqi (7.3%, a difference of 0.18%), Immigrants from Chile (7.3%, a difference of 0.30%), Immigrants from Bosnia and Herzegovina (7.3%, a difference of 0.31%), and Immigrants from Kenya (7.3%, a difference of 0.33%).
| Demographics | Rating | Rank | Unemployment Among Women with Children Under 6 years |
| Norwegians | 96.7 /100 | #111 | Exceptional 7.2% |
| Israelis | 96.5 /100 | #112 | Exceptional 7.2% |
| Nicaraguans | 96.3 /100 | #113 | Exceptional 7.2% |
| Argentineans | 96.2 /100 | #114 | Exceptional 7.2% |
| Immigrants | Italy | 96.1 /100 | #115 | Exceptional 7.2% |
| Armenians | 95.9 /100 | #116 | Exceptional 7.2% |
| Immigrants | Kenya | 95.4 /100 | #117 | Exceptional 7.3% |
| Serbians | 94.5 /100 | #118 | Exceptional 7.3% |
| South Africans | 94.1 /100 | #119 | Exceptional 7.3% |
| Iraqis | 93.9 /100 | #120 | Exceptional 7.3% |
| Immigrants | Chile | 93.5 /100 | #121 | Exceptional 7.3% |
| Immigrants | Bosnia and Herzegovina | 93.5 /100 | #122 | Exceptional 7.3% |
| Immigrants | Zaire | 93.3 /100 | #123 | Exceptional 7.3% |
| Immigrants | South Africa | 92.5 /100 | #124 | Exceptional 7.3% |
| Pakistanis | 92.2 /100 | #125 | Exceptional 7.3% |