Spaniard vs Jamaican 6th Grade
COMPARE
Spaniard
Jamaican
6th Grade
6th Grade Comparison
Spaniards
Jamaicans
97.2%
6TH GRADE
80.1/ 100
METRIC RATING
145th/ 347
METRIC RANK
96.5%
6TH GRADE
0.6/ 100
METRIC RATING
253rd/ 347
METRIC RANK
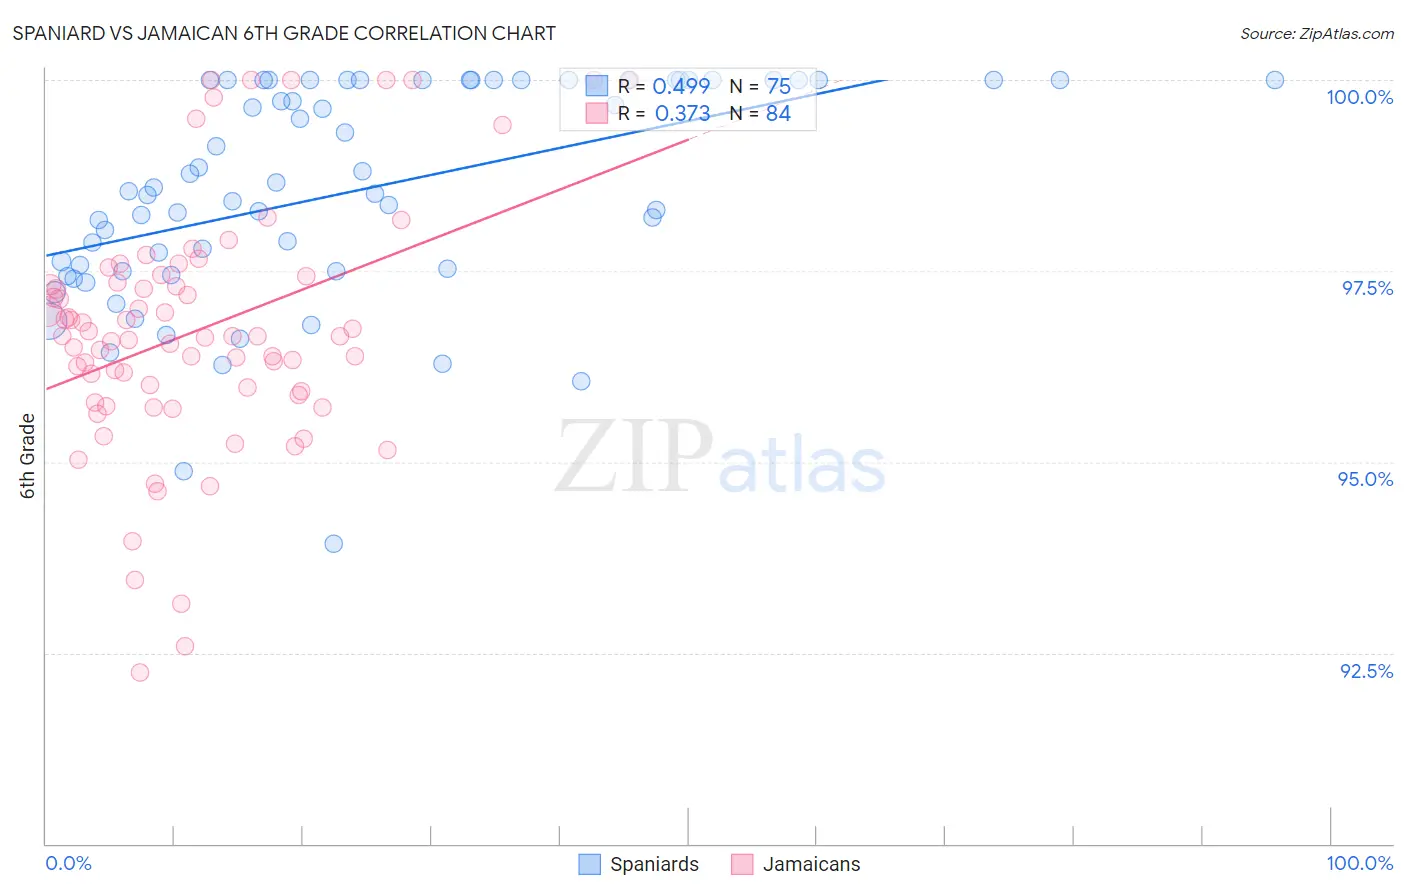
Spaniard vs Jamaican 6th Grade Correlation Chart
The statistical analysis conducted on geographies consisting of 443,544,503 people shows a moderate positive correlation between the proportion of Spaniards and percentage of population with at least 6th grade education in the United States with a correlation coefficient (R) of 0.499 and weighted average of 97.2%. Similarly, the statistical analysis conducted on geographies consisting of 368,084,189 people shows a mild positive correlation between the proportion of Jamaicans and percentage of population with at least 6th grade education in the United States with a correlation coefficient (R) of 0.373 and weighted average of 96.5%, a difference of 0.75%.
6th Grade Correlation Summary
| Measurement | Spaniard | Jamaican |
| Minimum | 93.9% | 92.2% |
| Maximum | 100.0% | 100.0% |
| Range | 6.1% | 7.8% |
| Mean | 98.5% | 96.7% |
| Median | 98.5% | 96.6% |
| Interquartile 25% (IQ1) | 97.5% | 95.9% |
| Interquartile 75% (IQ3) | 100.0% | 97.4% |
| Interquartile Range (IQR) | 2.5% | 1.5% |
| Standard Deviation (Sample) | 1.4% | 1.6% |
| Standard Deviation (Population) | 1.4% | 1.6% |
Similar Demographics by 6th Grade
Demographics Similar to Spaniards by 6th Grade
In terms of 6th grade, the demographic groups most similar to Spaniards are Hopi (97.2%, a difference of 0.010%), Immigrants from South Central Asia (97.2%, a difference of 0.010%), Pima (97.2%, a difference of 0.020%), Israeli (97.2%, a difference of 0.020%), and Immigrants from Greece (97.2%, a difference of 0.020%).
| Demographics | Rating | Rank | 6th Grade |
| Blackfeet | 87.7 /100 | #138 | Excellent 97.3% |
| Immigrants | Turkey | 86.1 /100 | #139 | Excellent 97.3% |
| Immigrants | North Macedonia | 85.5 /100 | #140 | Excellent 97.2% |
| Seminole | 84.8 /100 | #141 | Excellent 97.2% |
| Jordanians | 84.6 /100 | #142 | Excellent 97.2% |
| Pima | 82.9 /100 | #143 | Excellent 97.2% |
| Israelis | 82.9 /100 | #144 | Excellent 97.2% |
| Spaniards | 80.1 /100 | #145 | Excellent 97.2% |
| Hopi | 78.8 /100 | #146 | Good 97.2% |
| Immigrants | South Central Asia | 78.1 /100 | #147 | Good 97.2% |
| Immigrants | Greece | 77.8 /100 | #148 | Good 97.2% |
| Immigrants | Israel | 76.0 /100 | #149 | Good 97.2% |
| Immigrants | Bosnia and Herzegovina | 74.8 /100 | #150 | Good 97.2% |
| French American Indians | 74.0 /100 | #151 | Good 97.2% |
| Immigrants | Jordan | 73.0 /100 | #152 | Good 97.2% |
Demographics Similar to Jamaicans by 6th Grade
In terms of 6th grade, the demographic groups most similar to Jamaicans are Immigrants from Ethiopia (96.5%, a difference of 0.0%), Immigrants from Senegal (96.5%, a difference of 0.010%), Immigrants from Uruguay (96.5%, a difference of 0.010%), Immigrants from Congo (96.5%, a difference of 0.010%), and U.S. Virgin Islander (96.5%, a difference of 0.010%).
| Demographics | Rating | Rank | 6th Grade |
| Immigrants | Africa | 1.3 /100 | #246 | Tragic 96.6% |
| Bolivians | 1.0 /100 | #247 | Tragic 96.5% |
| Tohono O'odham | 1.0 /100 | #248 | Tragic 96.5% |
| Colombians | 0.9 /100 | #249 | Tragic 96.5% |
| Immigrants | Middle Africa | 0.8 /100 | #250 | Tragic 96.5% |
| Immigrants | Senegal | 0.7 /100 | #251 | Tragic 96.5% |
| Immigrants | Uruguay | 0.6 /100 | #252 | Tragic 96.5% |
| Jamaicans | 0.6 /100 | #253 | Tragic 96.5% |
| Immigrants | Ethiopia | 0.6 /100 | #254 | Tragic 96.5% |
| Immigrants | Congo | 0.6 /100 | #255 | Tragic 96.5% |
| U.S. Virgin Islanders | 0.5 /100 | #256 | Tragic 96.5% |
| Taiwanese | 0.5 /100 | #257 | Tragic 96.5% |
| Immigrants | China | 0.4 /100 | #258 | Tragic 96.4% |
| South Americans | 0.4 /100 | #259 | Tragic 96.4% |
| Peruvians | 0.4 /100 | #260 | Tragic 96.4% |