Spaniard vs Jamaican In Labor Force | Age 35-44
COMPARE
Spaniard
Jamaican
In Labor Force | Age 35-44
In Labor Force | Age 35-44 Comparison
Spaniards
Jamaicans
83.4%
IN LABOR FORCE | AGE 35-44
0.1/ 100
METRIC RATING
266th/ 347
METRIC RANK
84.4%
IN LABOR FORCE | AGE 35-44
62.7/ 100
METRIC RATING
158th/ 347
METRIC RANK
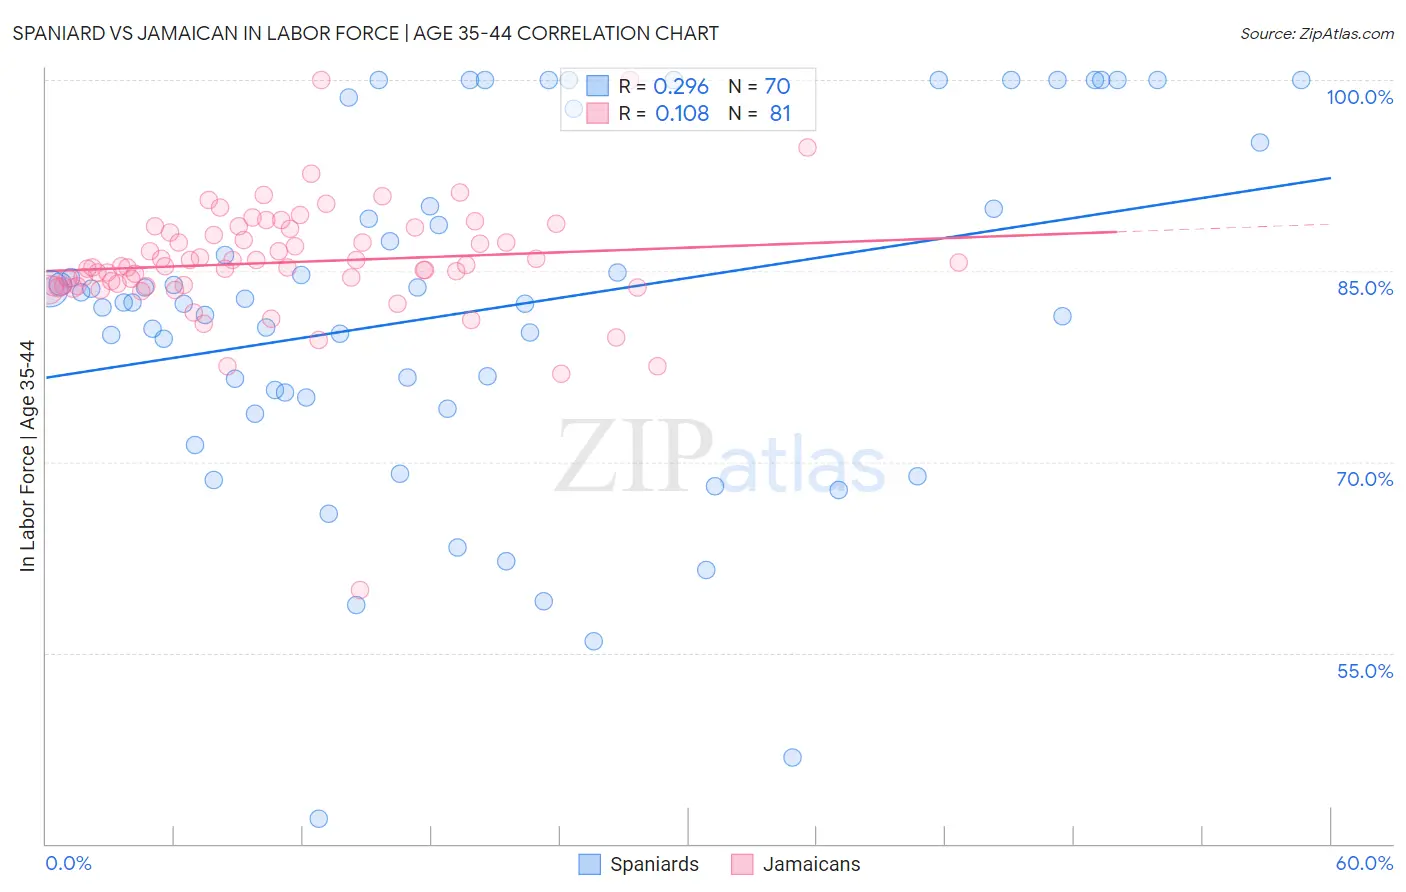
Spaniard vs Jamaican In Labor Force | Age 35-44 Correlation Chart
The statistical analysis conducted on geographies consisting of 443,255,372 people shows a weak positive correlation between the proportion of Spaniards and labor force participation rate among population between the ages 35 and 44 in the United States with a correlation coefficient (R) of 0.296 and weighted average of 83.4%. Similarly, the statistical analysis conducted on geographies consisting of 367,727,365 people shows a poor positive correlation between the proportion of Jamaicans and labor force participation rate among population between the ages 35 and 44 in the United States with a correlation coefficient (R) of 0.108 and weighted average of 84.4%, a difference of 1.2%.
In Labor Force | Age 35-44 Correlation Summary
| Measurement | Spaniard | Jamaican |
| Minimum | 41.9% | 59.9% |
| Maximum | 100.0% | 100.0% |
| Range | 58.1% | 40.1% |
| Mean | 81.9% | 85.7% |
| Median | 82.5% | 85.4% |
| Interquartile 25% (IQ1) | 75.0% | 83.8% |
| Interquartile 75% (IQ3) | 90.1% | 88.2% |
| Interquartile Range (IQR) | 15.1% | 4.3% |
| Standard Deviation (Sample) | 13.7% | 4.9% |
| Standard Deviation (Population) | 13.6% | 4.9% |
Similar Demographics by In Labor Force | Age 35-44
Demographics Similar to Spaniards by In Labor Force | Age 35-44
In terms of in labor force | age 35-44, the demographic groups most similar to Spaniards are Scotch-Irish (83.5%, a difference of 0.040%), Central American (83.5%, a difference of 0.040%), Guamanian/Chamorro (83.4%, a difference of 0.050%), Iroquois (83.5%, a difference of 0.070%), and Honduran (83.4%, a difference of 0.080%).
| Demographics | Rating | Rank | In Labor Force | Age 35-44 |
| Immigrants | El Salvador | 0.2 /100 | #259 | Tragic 83.5% |
| Vietnamese | 0.2 /100 | #260 | Tragic 83.5% |
| Immigrants | Dominica | 0.2 /100 | #261 | Tragic 83.5% |
| Immigrants | Congo | 0.2 /100 | #262 | Tragic 83.5% |
| Iroquois | 0.2 /100 | #263 | Tragic 83.5% |
| Scotch-Irish | 0.1 /100 | #264 | Tragic 83.5% |
| Central Americans | 0.1 /100 | #265 | Tragic 83.5% |
| Spaniards | 0.1 /100 | #266 | Tragic 83.4% |
| Guamanians/Chamorros | 0.1 /100 | #267 | Tragic 83.4% |
| Hondurans | 0.1 /100 | #268 | Tragic 83.4% |
| Immigrants | Grenada | 0.1 /100 | #269 | Tragic 83.3% |
| Immigrants | Honduras | 0.0 /100 | #270 | Tragic 83.3% |
| French American Indians | 0.0 /100 | #271 | Tragic 83.2% |
| Immigrants | Fiji | 0.0 /100 | #272 | Tragic 83.2% |
| Spanish | 0.0 /100 | #273 | Tragic 83.2% |
Demographics Similar to Jamaicans by In Labor Force | Age 35-44
In terms of in labor force | age 35-44, the demographic groups most similar to Jamaicans are Immigrants from Israel (84.4%, a difference of 0.010%), Immigrants from Austria (84.4%, a difference of 0.010%), Immigrants from Switzerland (84.5%, a difference of 0.020%), Immigrants from Senegal (84.4%, a difference of 0.020%), and Immigrants from Kazakhstan (84.4%, a difference of 0.020%).
| Demographics | Rating | Rank | In Labor Force | Age 35-44 |
| Romanians | 72.1 /100 | #151 | Good 84.5% |
| Immigrants | Taiwan | 71.4 /100 | #152 | Good 84.5% |
| Trinidadians and Tobagonians | 69.5 /100 | #153 | Good 84.5% |
| Iranians | 69.4 /100 | #154 | Good 84.5% |
| Immigrants | Switzerland | 65.9 /100 | #155 | Good 84.5% |
| Immigrants | Israel | 64.3 /100 | #156 | Good 84.4% |
| Immigrants | Austria | 63.8 /100 | #157 | Good 84.4% |
| Jamaicans | 62.7 /100 | #158 | Good 84.4% |
| Immigrants | Senegal | 60.4 /100 | #159 | Good 84.4% |
| Immigrants | Kazakhstan | 60.4 /100 | #160 | Good 84.4% |
| Immigrants | Venezuela | 60.0 /100 | #161 | Good 84.4% |
| Immigrants | Hungary | 59.4 /100 | #162 | Average 84.4% |
| Aleuts | 59.1 /100 | #163 | Average 84.4% |
| Nigerians | 58.9 /100 | #164 | Average 84.4% |
| Venezuelans | 58.1 /100 | #165 | Average 84.4% |