Spaniard vs Indian (Asian) Unemployment Among Women with Children Under 6 years
COMPARE
Spaniard
Indian (Asian)
Unemployment Among Women with Children Under 6 years
Unemployment Among Women with Children Under 6 years Comparison
Spaniards
Indians (Asian)
7.8%
UNEMPLOYMENT AMONG WOMEN WITH CHILDREN UNDER 6 YEARS
23.3/ 100
METRIC RATING
203rd/ 347
METRIC RANK
6.3%
UNEMPLOYMENT AMONG WOMEN WITH CHILDREN UNDER 6 YEARS
100.0/ 100
METRIC RATING
11th/ 347
METRIC RANK
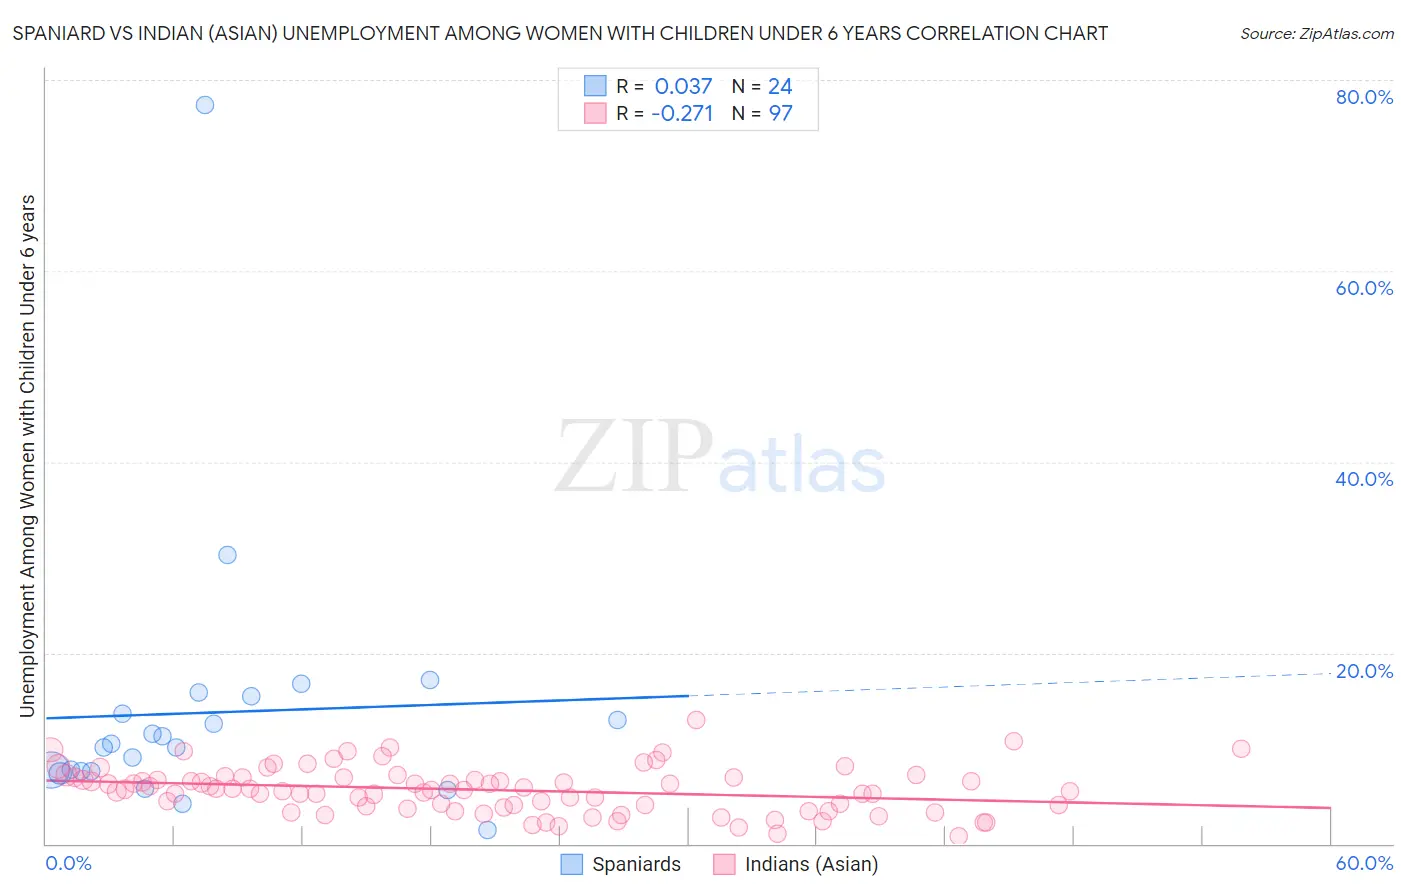
Spaniard vs Indian (Asian) Unemployment Among Women with Children Under 6 years Correlation Chart
The statistical analysis conducted on geographies consisting of 330,047,917 people shows no correlation between the proportion of Spaniards and unemployment rate among women with children under the age of 6 in the United States with a correlation coefficient (R) of 0.037 and weighted average of 7.8%. Similarly, the statistical analysis conducted on geographies consisting of 353,579,018 people shows a weak negative correlation between the proportion of Indians (Asian) and unemployment rate among women with children under the age of 6 in the United States with a correlation coefficient (R) of -0.271 and weighted average of 6.3%, a difference of 23.8%.
Unemployment Among Women with Children Under 6 years Correlation Summary
| Measurement | Spaniard | Indian (Asian) |
| Minimum | 1.5% | 0.80% |
| Maximum | 77.4% | 13.0% |
| Range | 75.9% | 12.2% |
| Mean | 13.7% | 5.6% |
| Median | 10.3% | 5.7% |
| Interquartile 25% (IQ1) | 7.6% | 3.8% |
| Interquartile 75% (IQ3) | 14.5% | 6.9% |
| Interquartile Range (IQR) | 6.9% | 3.1% |
| Standard Deviation (Sample) | 14.7% | 2.4% |
| Standard Deviation (Population) | 14.4% | 2.4% |
Similar Demographics by Unemployment Among Women with Children Under 6 years
Demographics Similar to Spaniards by Unemployment Among Women with Children Under 6 years
In terms of unemployment among women with children under 6 years, the demographic groups most similar to Spaniards are Sudanese (7.8%, a difference of 0.010%), Lebanese (7.8%, a difference of 0.11%), Basque (7.8%, a difference of 0.12%), Immigrants (7.8%, a difference of 0.18%), and Guamanian/Chamorro (7.8%, a difference of 0.19%).
| Demographics | Rating | Rank | Unemployment Among Women with Children Under 6 years |
| Immigrants | St. Vincent and the Grenadines | 31.1 /100 | #196 | Fair 7.7% |
| Italians | 30.4 /100 | #197 | Fair 7.7% |
| Lithuanians | 30.0 /100 | #198 | Fair 7.8% |
| Immigrants | Poland | 27.3 /100 | #199 | Fair 7.8% |
| Guamanians/Chamorros | 25.5 /100 | #200 | Fair 7.8% |
| Basques | 24.7 /100 | #201 | Fair 7.8% |
| Sudanese | 23.5 /100 | #202 | Fair 7.8% |
| Spaniards | 23.3 /100 | #203 | Fair 7.8% |
| Lebanese | 22.2 /100 | #204 | Fair 7.8% |
| Immigrants | Immigrants | 21.4 /100 | #205 | Fair 7.8% |
| Hungarians | 21.2 /100 | #206 | Fair 7.8% |
| Canadians | 20.6 /100 | #207 | Fair 7.8% |
| Immigrants | Syria | 18.9 /100 | #208 | Poor 7.8% |
| Costa Ricans | 17.6 /100 | #209 | Poor 7.8% |
| Poles | 16.0 /100 | #210 | Poor 7.9% |
Demographics Similar to Indians (Asian) by Unemployment Among Women with Children Under 6 years
In terms of unemployment among women with children under 6 years, the demographic groups most similar to Indians (Asian) are Immigrants from Singapore (6.3%, a difference of 0.020%), Immigrants from Eastern Asia (6.3%, a difference of 0.070%), Immigrants from Bulgaria (6.3%, a difference of 0.39%), Thai (6.3%, a difference of 0.49%), and Immigrants from Uzbekistan (6.3%, a difference of 0.79%).
| Demographics | Rating | Rank | Unemployment Among Women with Children Under 6 years |
| Cambodians | 100.0 /100 | #4 | Exceptional 5.9% |
| Cape Verdeans | 100.0 /100 | #5 | Exceptional 5.9% |
| Immigrants | Taiwan | 100.0 /100 | #6 | Exceptional 6.0% |
| Taiwanese | 100.0 /100 | #7 | Exceptional 6.1% |
| Immigrants | India | 100.0 /100 | #8 | Exceptional 6.1% |
| Filipinos | 100.0 /100 | #9 | Exceptional 6.1% |
| Immigrants | China | 100.0 /100 | #10 | Exceptional 6.2% |
| Indians (Asian) | 100.0 /100 | #11 | Exceptional 6.3% |
| Immigrants | Singapore | 100.0 /100 | #12 | Exceptional 6.3% |
| Immigrants | Eastern Asia | 100.0 /100 | #13 | Exceptional 6.3% |
| Immigrants | Bulgaria | 100.0 /100 | #14 | Exceptional 6.3% |
| Thais | 100.0 /100 | #15 | Exceptional 6.3% |
| Immigrants | Uzbekistan | 100.0 /100 | #16 | Exceptional 6.3% |
| Immigrants | Malaysia | 100.0 /100 | #17 | Exceptional 6.4% |
| Assyrians/Chaldeans/Syriacs | 100.0 /100 | #18 | Exceptional 6.5% |