Immigrants from Uruguay vs Indian (Asian) Unemployment Among Women with Children Under 6 years
COMPARE
Immigrants from Uruguay
Indian (Asian)
Unemployment Among Women with Children Under 6 years
Unemployment Among Women with Children Under 6 years Comparison
Immigrants from Uruguay
Indians (Asian)
7.7%
UNEMPLOYMENT AMONG WOMEN WITH CHILDREN UNDER 6 YEARS
44.5/ 100
METRIC RATING
180th/ 347
METRIC RANK
6.3%
UNEMPLOYMENT AMONG WOMEN WITH CHILDREN UNDER 6 YEARS
100.0/ 100
METRIC RATING
11th/ 347
METRIC RANK
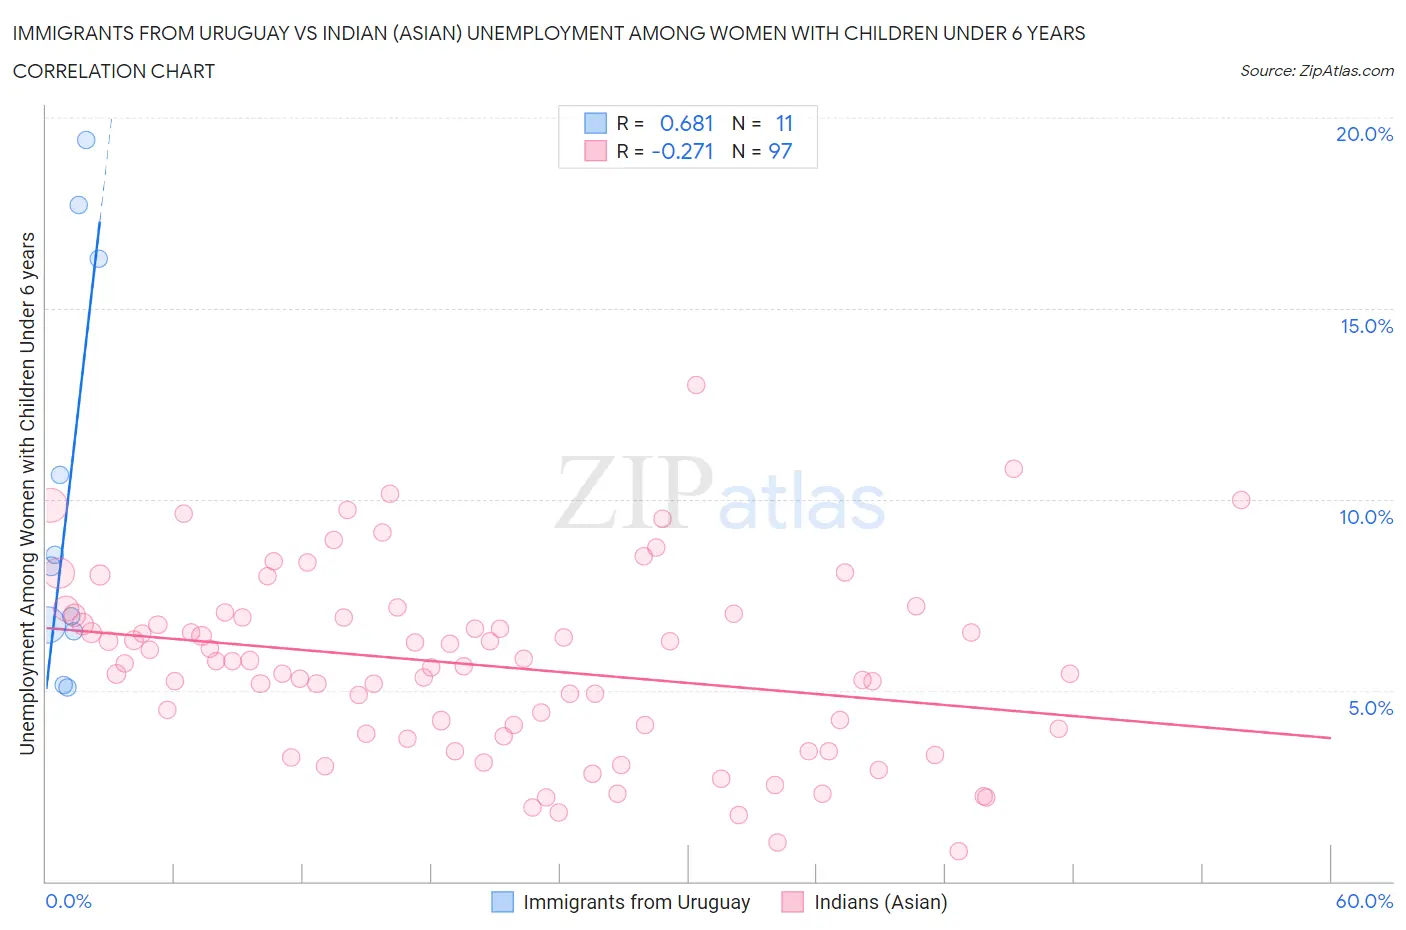
Immigrants from Uruguay vs Indian (Asian) Unemployment Among Women with Children Under 6 years Correlation Chart
The statistical analysis conducted on geographies consisting of 118,165,185 people shows a significant positive correlation between the proportion of Immigrants from Uruguay and unemployment rate among women with children under the age of 6 in the United States with a correlation coefficient (R) of 0.681 and weighted average of 7.7%. Similarly, the statistical analysis conducted on geographies consisting of 353,579,018 people shows a weak negative correlation between the proportion of Indians (Asian) and unemployment rate among women with children under the age of 6 in the United States with a correlation coefficient (R) of -0.271 and weighted average of 6.3%, a difference of 21.8%.
Unemployment Among Women with Children Under 6 years Correlation Summary
| Measurement | Immigrants from Uruguay | Indian (Asian) |
| Minimum | 5.1% | 0.80% |
| Maximum | 19.4% | 13.0% |
| Range | 14.3% | 12.2% |
| Mean | 10.1% | 5.6% |
| Median | 8.2% | 5.7% |
| Interquartile 25% (IQ1) | 6.6% | 3.8% |
| Interquartile 75% (IQ3) | 16.3% | 6.9% |
| Interquartile Range (IQR) | 9.7% | 3.1% |
| Standard Deviation (Sample) | 5.2% | 2.4% |
| Standard Deviation (Population) | 5.0% | 2.4% |
Similar Demographics by Unemployment Among Women with Children Under 6 years
Demographics Similar to Immigrants from Uruguay by Unemployment Among Women with Children Under 6 years
In terms of unemployment among women with children under 6 years, the demographic groups most similar to Immigrants from Uruguay are Immigrants from Western Europe (7.7%, a difference of 0.030%), Brazilian (7.7%, a difference of 0.040%), Immigrants from England (7.7%, a difference of 0.060%), Nepalese (7.7%, a difference of 0.060%), and Austrian (7.7%, a difference of 0.10%).
| Demographics | Rating | Rank | Unemployment Among Women with Children Under 6 years |
| Cree | 51.6 /100 | #173 | Average 7.6% |
| Immigrants | Laos | 50.0 /100 | #174 | Average 7.6% |
| Panamanians | 49.6 /100 | #175 | Average 7.6% |
| Puget Sound Salish | 47.7 /100 | #176 | Average 7.7% |
| Austrians | 46.0 /100 | #177 | Average 7.7% |
| Immigrants | England | 45.4 /100 | #178 | Average 7.7% |
| Immigrants | Western Europe | 44.9 /100 | #179 | Average 7.7% |
| Immigrants | Uruguay | 44.5 /100 | #180 | Average 7.7% |
| Brazilians | 43.9 /100 | #181 | Average 7.7% |
| Nepalese | 43.5 /100 | #182 | Average 7.7% |
| Sierra Leoneans | 42.9 /100 | #183 | Average 7.7% |
| Indonesians | 40.5 /100 | #184 | Average 7.7% |
| Spanish Americans | 39.7 /100 | #185 | Fair 7.7% |
| Yugoslavians | 39.4 /100 | #186 | Fair 7.7% |
| Immigrants | Thailand | 38.5 /100 | #187 | Fair 7.7% |
Demographics Similar to Indians (Asian) by Unemployment Among Women with Children Under 6 years
In terms of unemployment among women with children under 6 years, the demographic groups most similar to Indians (Asian) are Immigrants from Singapore (6.3%, a difference of 0.020%), Immigrants from Eastern Asia (6.3%, a difference of 0.070%), Immigrants from Bulgaria (6.3%, a difference of 0.39%), Thai (6.3%, a difference of 0.49%), and Immigrants from Uzbekistan (6.3%, a difference of 0.79%).
| Demographics | Rating | Rank | Unemployment Among Women with Children Under 6 years |
| Cambodians | 100.0 /100 | #4 | Exceptional 5.9% |
| Cape Verdeans | 100.0 /100 | #5 | Exceptional 5.9% |
| Immigrants | Taiwan | 100.0 /100 | #6 | Exceptional 6.0% |
| Taiwanese | 100.0 /100 | #7 | Exceptional 6.1% |
| Immigrants | India | 100.0 /100 | #8 | Exceptional 6.1% |
| Filipinos | 100.0 /100 | #9 | Exceptional 6.1% |
| Immigrants | China | 100.0 /100 | #10 | Exceptional 6.2% |
| Indians (Asian) | 100.0 /100 | #11 | Exceptional 6.3% |
| Immigrants | Singapore | 100.0 /100 | #12 | Exceptional 6.3% |
| Immigrants | Eastern Asia | 100.0 /100 | #13 | Exceptional 6.3% |
| Immigrants | Bulgaria | 100.0 /100 | #14 | Exceptional 6.3% |
| Thais | 100.0 /100 | #15 | Exceptional 6.3% |
| Immigrants | Uzbekistan | 100.0 /100 | #16 | Exceptional 6.3% |
| Immigrants | Malaysia | 100.0 /100 | #17 | Exceptional 6.4% |
| Assyrians/Chaldeans/Syriacs | 100.0 /100 | #18 | Exceptional 6.5% |