Spaniard vs Indian (Asian) 10th Grade
COMPARE
Spaniard
Indian (Asian)
10th Grade
10th Grade Comparison
Spaniards
Indians (Asian)
93.7%
10TH GRADE
50.3/ 100
METRIC RATING
173rd/ 347
METRIC RANK
93.4%
10TH GRADE
17.6/ 100
METRIC RATING
210th/ 347
METRIC RANK
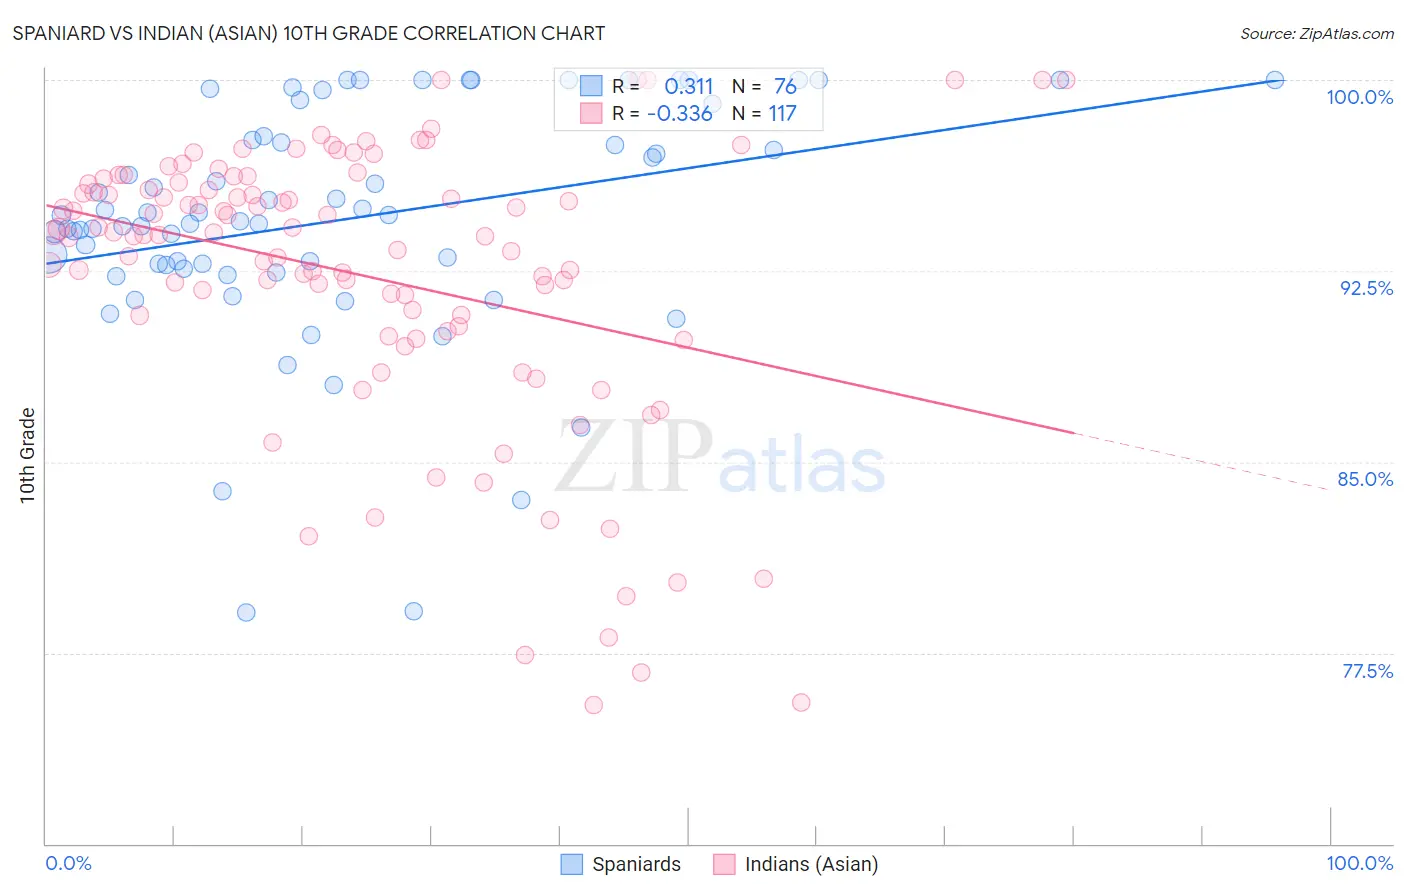
Spaniard vs Indian (Asian) 10th Grade Correlation Chart
The statistical analysis conducted on geographies consisting of 443,545,794 people shows a mild positive correlation between the proportion of Spaniards and percentage of population with at least 10th grade education in the United States with a correlation coefficient (R) of 0.311 and weighted average of 93.7%. Similarly, the statistical analysis conducted on geographies consisting of 495,348,182 people shows a mild negative correlation between the proportion of Indians (Asian) and percentage of population with at least 10th grade education in the United States with a correlation coefficient (R) of -0.336 and weighted average of 93.4%, a difference of 0.35%.
10th Grade Correlation Summary
| Measurement | Spaniard | Indian (Asian) |
| Minimum | 79.1% | 75.5% |
| Maximum | 100.0% | 100.0% |
| Range | 20.9% | 24.5% |
| Mean | 94.5% | 92.3% |
| Median | 94.6% | 93.9% |
| Interquartile 25% (IQ1) | 92.6% | 90.2% |
| Interquartile 75% (IQ3) | 97.7% | 95.9% |
| Interquartile Range (IQR) | 5.1% | 5.7% |
| Standard Deviation (Sample) | 4.6% | 5.6% |
| Standard Deviation (Population) | 4.6% | 5.5% |
Similar Demographics by 10th Grade
Demographics Similar to Spaniards by 10th Grade
In terms of 10th grade, the demographic groups most similar to Spaniards are Argentinean (93.7%, a difference of 0.0%), French American Indian (93.7%, a difference of 0.010%), Immigrants from Nepal (93.7%, a difference of 0.010%), Immigrants from Albania (93.8%, a difference of 0.020%), and Immigrants from Venezuela (93.8%, a difference of 0.030%).
| Demographics | Rating | Rank | 10th Grade |
| Immigrants | Iraq | 63.0 /100 | #166 | Good 93.8% |
| Immigrants | Egypt | 62.3 /100 | #167 | Good 93.8% |
| Alsatians | 59.4 /100 | #168 | Average 93.8% |
| Immigrants | Spain | 55.9 /100 | #169 | Average 93.8% |
| Immigrants | Venezuela | 53.9 /100 | #170 | Average 93.8% |
| Immigrants | Albania | 52.4 /100 | #171 | Average 93.8% |
| French American Indians | 50.9 /100 | #172 | Average 93.7% |
| Spaniards | 50.3 /100 | #173 | Average 93.7% |
| Argentineans | 50.0 /100 | #174 | Average 93.7% |
| Immigrants | Nepal | 49.6 /100 | #175 | Average 93.7% |
| Immigrants | Argentina | 47.1 /100 | #176 | Average 93.7% |
| Immigrants | Lebanon | 47.1 /100 | #177 | Average 93.7% |
| Sierra Leoneans | 46.1 /100 | #178 | Average 93.7% |
| Paraguayans | 45.3 /100 | #179 | Average 93.7% |
| Blackfeet | 42.8 /100 | #180 | Average 93.7% |
Demographics Similar to Indians (Asian) by 10th Grade
In terms of 10th grade, the demographic groups most similar to Indians (Asian) are Cajun (93.4%, a difference of 0.010%), Immigrants from Zaire (93.4%, a difference of 0.010%), Immigrants from Chile (93.4%, a difference of 0.020%), Samoan (93.4%, a difference of 0.030%), and Immigrants from Syria (93.4%, a difference of 0.030%).
| Demographics | Rating | Rank | 10th Grade |
| Immigrants | Western Asia | 20.6 /100 | #203 | Fair 93.4% |
| Ute | 20.3 /100 | #204 | Fair 93.4% |
| Immigrants | Indonesia | 20.2 /100 | #205 | Fair 93.4% |
| Immigrants | Sudan | 20.0 /100 | #206 | Fair 93.4% |
| Samoans | 19.5 /100 | #207 | Poor 93.4% |
| Immigrants | Syria | 19.4 /100 | #208 | Poor 93.4% |
| Immigrants | Chile | 18.8 /100 | #209 | Poor 93.4% |
| Indians (Asian) | 17.6 /100 | #210 | Poor 93.4% |
| Cajuns | 16.9 /100 | #211 | Poor 93.4% |
| Immigrants | Zaire | 16.7 /100 | #212 | Poor 93.4% |
| Immigrants | Asia | 15.7 /100 | #213 | Poor 93.4% |
| Immigrants | Bahamas | 15.2 /100 | #214 | Poor 93.4% |
| Immigrants | Oceania | 15.1 /100 | #215 | Poor 93.4% |
| Immigrants | Eastern Africa | 14.7 /100 | #216 | Poor 93.4% |
| Portuguese | 12.1 /100 | #217 | Poor 93.3% |