Eastern European vs Indian (Asian) Unemployment Among Women with Children Under 6 years
COMPARE
Eastern European
Indian (Asian)
Unemployment Among Women with Children Under 6 years
Unemployment Among Women with Children Under 6 years Comparison
Eastern Europeans
Indians (Asian)
7.2%
UNEMPLOYMENT AMONG WOMEN WITH CHILDREN UNDER 6 YEARS
96.9/ 100
METRIC RATING
108th/ 347
METRIC RANK
6.3%
UNEMPLOYMENT AMONG WOMEN WITH CHILDREN UNDER 6 YEARS
100.0/ 100
METRIC RATING
11th/ 347
METRIC RANK
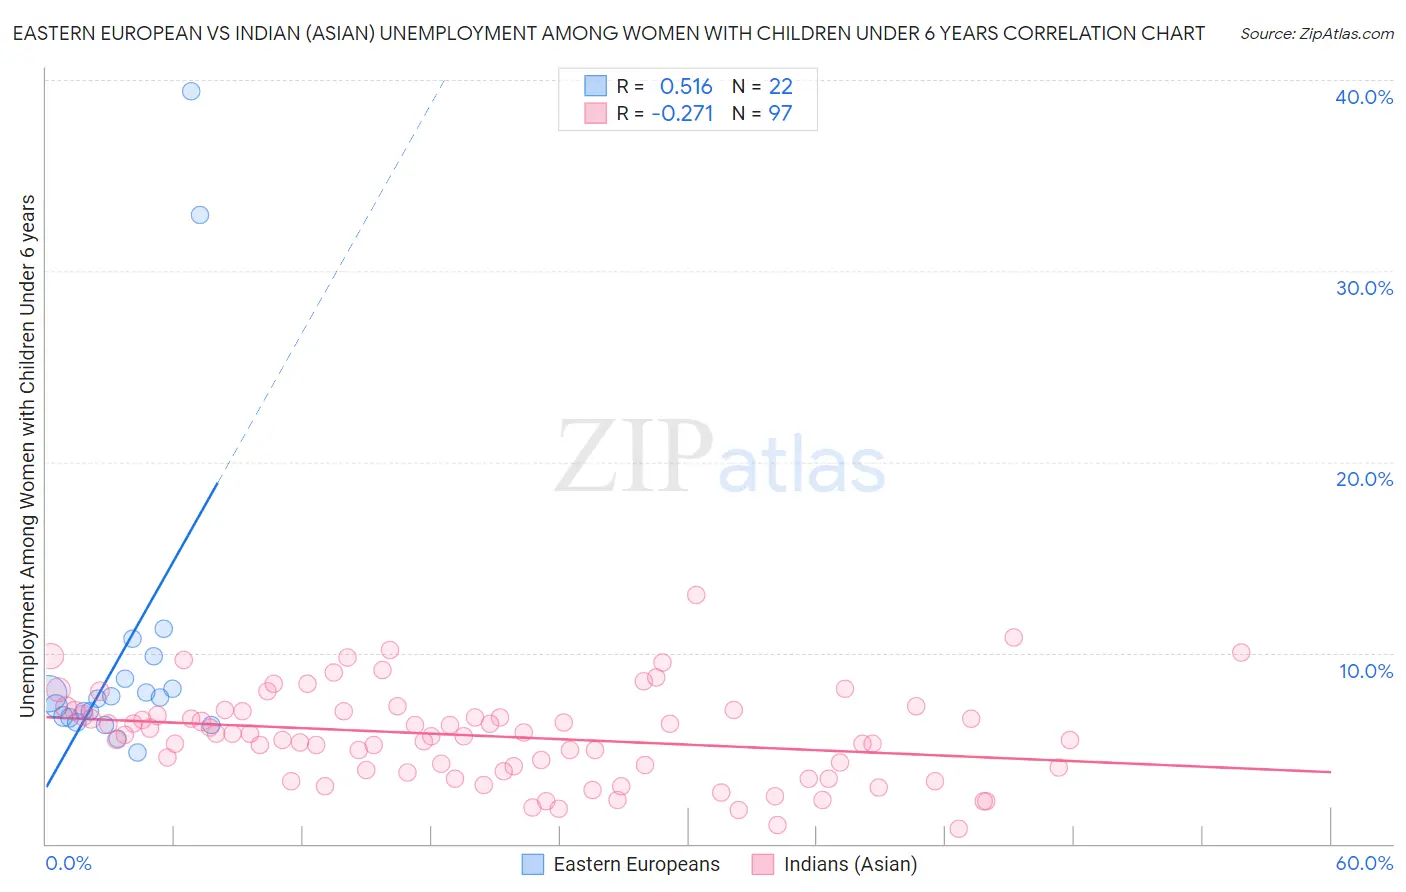
Eastern European vs Indian (Asian) Unemployment Among Women with Children Under 6 years Correlation Chart
The statistical analysis conducted on geographies consisting of 326,999,970 people shows a substantial positive correlation between the proportion of Eastern Europeans and unemployment rate among women with children under the age of 6 in the United States with a correlation coefficient (R) of 0.516 and weighted average of 7.2%. Similarly, the statistical analysis conducted on geographies consisting of 353,579,018 people shows a weak negative correlation between the proportion of Indians (Asian) and unemployment rate among women with children under the age of 6 in the United States with a correlation coefficient (R) of -0.271 and weighted average of 6.3%, a difference of 14.4%.
Unemployment Among Women with Children Under 6 years Correlation Summary
| Measurement | Eastern European | Indian (Asian) |
| Minimum | 4.8% | 0.80% |
| Maximum | 39.4% | 13.0% |
| Range | 34.6% | 12.2% |
| Mean | 10.1% | 5.6% |
| Median | 7.6% | 5.7% |
| Interquartile 25% (IQ1) | 6.6% | 3.8% |
| Interquartile 75% (IQ3) | 8.6% | 6.9% |
| Interquartile Range (IQR) | 2.0% | 3.1% |
| Standard Deviation (Sample) | 8.6% | 2.4% |
| Standard Deviation (Population) | 8.4% | 2.4% |
Similar Demographics by Unemployment Among Women with Children Under 6 years
Demographics Similar to Eastern Europeans by Unemployment Among Women with Children Under 6 years
In terms of unemployment among women with children under 6 years, the demographic groups most similar to Eastern Europeans are Australian (7.2%, a difference of 0.010%), Palestinian (7.2%, a difference of 0.080%), Immigrants from Kazakhstan (7.2%, a difference of 0.12%), Norwegian (7.2%, a difference of 0.13%), and Immigrants from Pakistan (7.2%, a difference of 0.14%).
| Demographics | Rating | Rank | Unemployment Among Women with Children Under 6 years |
| Chileans | 97.4 /100 | #101 | Exceptional 7.2% |
| Immigrants | Nicaragua | 97.3 /100 | #102 | Exceptional 7.2% |
| Immigrants | Saudi Arabia | 97.3 /100 | #103 | Exceptional 7.2% |
| Immigrants | Egypt | 97.2 /100 | #104 | Exceptional 7.2% |
| Venezuelans | 97.2 /100 | #105 | Exceptional 7.2% |
| Immigrants | Pakistan | 97.2 /100 | #106 | Exceptional 7.2% |
| Immigrants | Kazakhstan | 97.1 /100 | #107 | Exceptional 7.2% |
| Eastern Europeans | 96.9 /100 | #108 | Exceptional 7.2% |
| Australians | 96.9 /100 | #109 | Exceptional 7.2% |
| Palestinians | 96.8 /100 | #110 | Exceptional 7.2% |
| Norwegians | 96.7 /100 | #111 | Exceptional 7.2% |
| Israelis | 96.5 /100 | #112 | Exceptional 7.2% |
| Nicaraguans | 96.3 /100 | #113 | Exceptional 7.2% |
| Argentineans | 96.2 /100 | #114 | Exceptional 7.2% |
| Immigrants | Italy | 96.1 /100 | #115 | Exceptional 7.2% |
Demographics Similar to Indians (Asian) by Unemployment Among Women with Children Under 6 years
In terms of unemployment among women with children under 6 years, the demographic groups most similar to Indians (Asian) are Immigrants from Singapore (6.3%, a difference of 0.020%), Immigrants from Eastern Asia (6.3%, a difference of 0.070%), Immigrants from Bulgaria (6.3%, a difference of 0.39%), Thai (6.3%, a difference of 0.49%), and Immigrants from Uzbekistan (6.3%, a difference of 0.79%).
| Demographics | Rating | Rank | Unemployment Among Women with Children Under 6 years |
| Cambodians | 100.0 /100 | #4 | Exceptional 5.9% |
| Cape Verdeans | 100.0 /100 | #5 | Exceptional 5.9% |
| Immigrants | Taiwan | 100.0 /100 | #6 | Exceptional 6.0% |
| Taiwanese | 100.0 /100 | #7 | Exceptional 6.1% |
| Immigrants | India | 100.0 /100 | #8 | Exceptional 6.1% |
| Filipinos | 100.0 /100 | #9 | Exceptional 6.1% |
| Immigrants | China | 100.0 /100 | #10 | Exceptional 6.2% |
| Indians (Asian) | 100.0 /100 | #11 | Exceptional 6.3% |
| Immigrants | Singapore | 100.0 /100 | #12 | Exceptional 6.3% |
| Immigrants | Eastern Asia | 100.0 /100 | #13 | Exceptional 6.3% |
| Immigrants | Bulgaria | 100.0 /100 | #14 | Exceptional 6.3% |
| Thais | 100.0 /100 | #15 | Exceptional 6.3% |
| Immigrants | Uzbekistan | 100.0 /100 | #16 | Exceptional 6.3% |
| Immigrants | Malaysia | 100.0 /100 | #17 | Exceptional 6.4% |
| Assyrians/Chaldeans/Syriacs | 100.0 /100 | #18 | Exceptional 6.5% |