Albanian vs Cuban Unemployment Among Women with Children Under 6 years
COMPARE
Albanian
Cuban
Unemployment Among Women with Children Under 6 years
Unemployment Among Women with Children Under 6 years Comparison
Albanians
Cubans
7.2%
UNEMPLOYMENT AMONG WOMEN WITH CHILDREN UNDER 6 YEARS
98.0/ 100
METRIC RATING
92nd/ 347
METRIC RANK
7.0%
UNEMPLOYMENT AMONG WOMEN WITH CHILDREN UNDER 6 YEARS
99.4/ 100
METRIC RATING
72nd/ 347
METRIC RANK
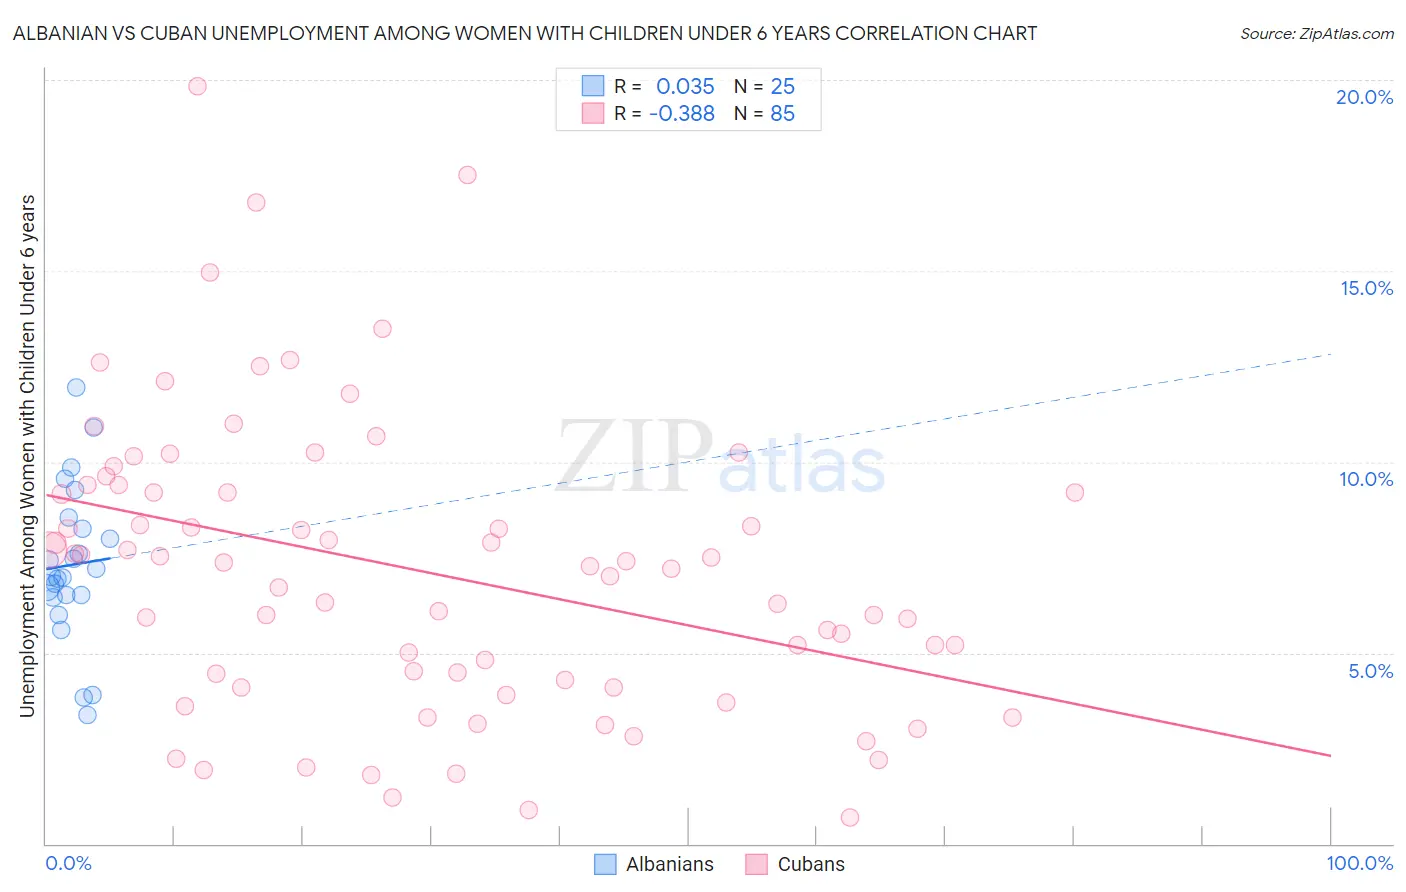
Albanian vs Cuban Unemployment Among Women with Children Under 6 years Correlation Chart
The statistical analysis conducted on geographies consisting of 159,066,011 people shows no correlation between the proportion of Albanians and unemployment rate among women with children under the age of 6 in the United States with a correlation coefficient (R) of 0.035 and weighted average of 7.2%. Similarly, the statistical analysis conducted on geographies consisting of 334,950,414 people shows a mild negative correlation between the proportion of Cubans and unemployment rate among women with children under the age of 6 in the United States with a correlation coefficient (R) of -0.388 and weighted average of 7.0%, a difference of 2.1%.
Unemployment Among Women with Children Under 6 years Correlation Summary
| Measurement | Albanian | Cuban |
| Minimum | 3.4% | 0.70% |
| Maximum | 12.0% | 19.8% |
| Range | 8.6% | 19.1% |
| Mean | 7.3% | 7.1% |
| Median | 7.0% | 7.3% |
| Interquartile 25% (IQ1) | 6.5% | 4.2% |
| Interquartile 75% (IQ3) | 8.4% | 9.3% |
| Interquartile Range (IQR) | 1.9% | 5.1% |
| Standard Deviation (Sample) | 2.0% | 3.8% |
| Standard Deviation (Population) | 2.0% | 3.8% |
Demographics Similar to Albanians and Cubans by Unemployment Among Women with Children Under 6 years
In terms of unemployment among women with children under 6 years, the demographic groups most similar to Albanians are Danish (7.1%, a difference of 0.14%), Immigrants from Spain (7.1%, a difference of 0.20%), Immigrants from Denmark (7.1%, a difference of 0.25%), Immigrants from Hungary (7.1%, a difference of 0.29%), and Alsatian (7.1%, a difference of 0.42%). Similarly, the demographic groups most similar to Cubans are Immigrants from Czechoslovakia (7.0%, a difference of 0.52%), Turkish (7.0%, a difference of 0.53%), Immigrants from Eastern Europe (7.1%, a difference of 0.92%), Estonian (7.1%, a difference of 0.97%), and Immigrants from Croatia (7.1%, a difference of 1.0%).
| Demographics | Rating | Rank | Unemployment Among Women with Children Under 6 years |
| Cubans | 99.4 /100 | #72 | Exceptional 7.0% |
| Immigrants | Czechoslovakia | 99.2 /100 | #73 | Exceptional 7.0% |
| Turks | 99.2 /100 | #74 | Exceptional 7.0% |
| Immigrants | Eastern Europe | 99.0 /100 | #75 | Exceptional 7.1% |
| Estonians | 99.0 /100 | #76 | Exceptional 7.1% |
| Immigrants | Croatia | 98.9 /100 | #77 | Exceptional 7.1% |
| Immigrants | Somalia | 98.9 /100 | #78 | Exceptional 7.1% |
| Immigrants | Fiji | 98.9 /100 | #79 | Exceptional 7.1% |
| Immigrants | Greece | 98.9 /100 | #80 | Exceptional 7.1% |
| Immigrants | Venezuela | 98.8 /100 | #81 | Exceptional 7.1% |
| Immigrants | Afghanistan | 98.7 /100 | #82 | Exceptional 7.1% |
| Egyptians | 98.7 /100 | #83 | Exceptional 7.1% |
| Immigrants | Albania | 98.7 /100 | #84 | Exceptional 7.1% |
| Immigrants | Romania | 98.7 /100 | #85 | Exceptional 7.1% |
| Immigrants | Zimbabwe | 98.6 /100 | #86 | Exceptional 7.1% |
| Alsatians | 98.4 /100 | #87 | Exceptional 7.1% |
| Immigrants | Hungary | 98.3 /100 | #88 | Exceptional 7.1% |
| Immigrants | Denmark | 98.3 /100 | #89 | Exceptional 7.1% |
| Immigrants | Spain | 98.2 /100 | #90 | Exceptional 7.1% |
| Danes | 98.2 /100 | #91 | Exceptional 7.1% |
| Albanians | 98.0 /100 | #92 | Exceptional 7.2% |