Tohono O'odham vs Immigrants from Hong Kong Unemployment
COMPARE
Tohono O'odham
Immigrants from Hong Kong
Unemployment
Unemployment Comparison
Tohono O'odham
Immigrants from Hong Kong
8.9%
UNEMPLOYMENT
0.0/ 100
METRIC RATING
341st/ 347
METRIC RANK
5.2%
UNEMPLOYMENT
75.2/ 100
METRIC RATING
152nd/ 347
METRIC RANK
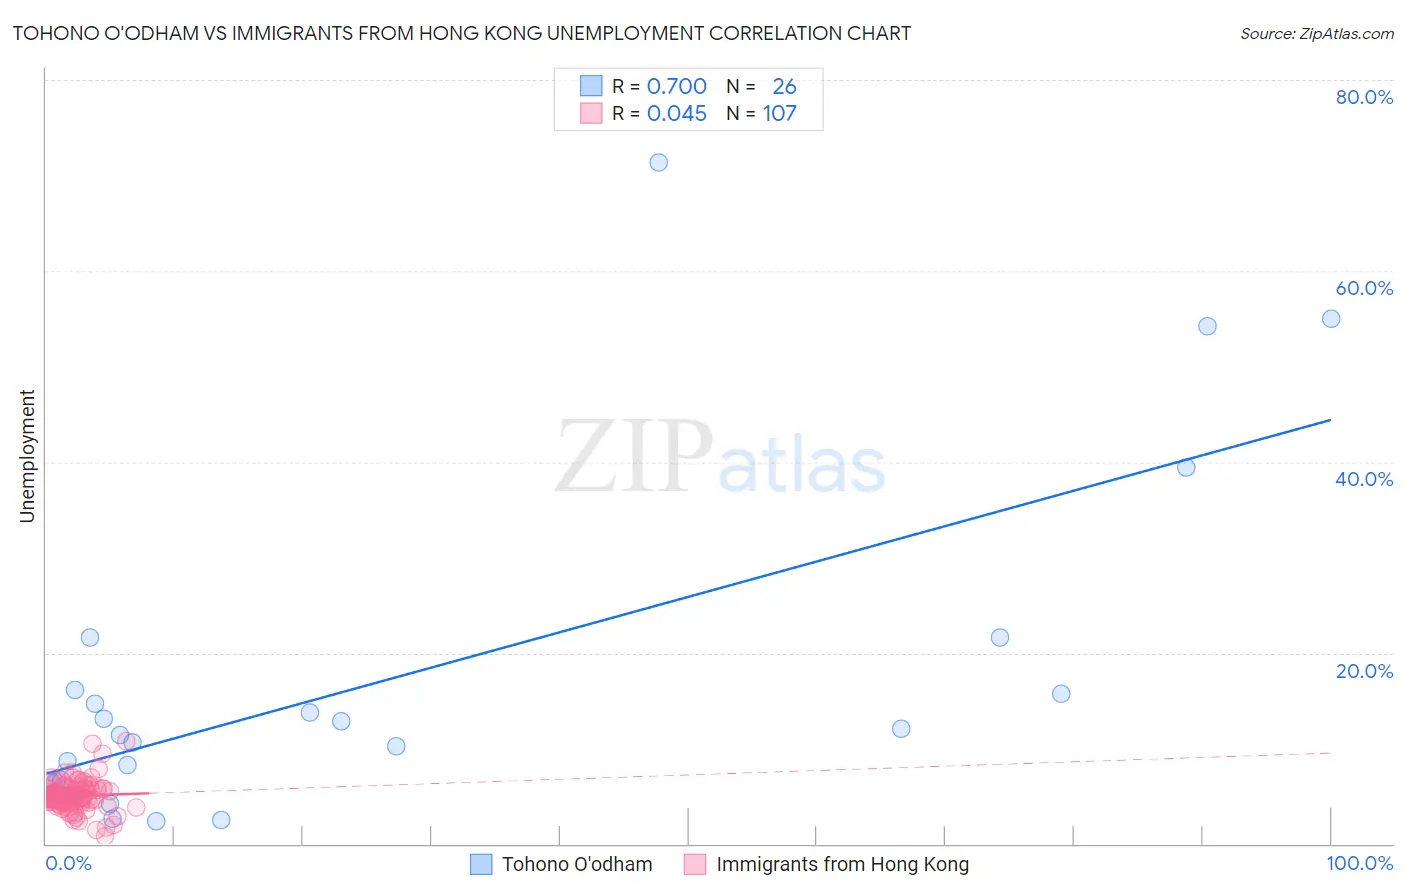
Tohono O'odham vs Immigrants from Hong Kong Unemployment Correlation Chart
The statistical analysis conducted on geographies consisting of 58,714,465 people shows a strong positive correlation between the proportion of Tohono O'odham and unemployment in the United States with a correlation coefficient (R) of 0.700 and weighted average of 8.9%. Similarly, the statistical analysis conducted on geographies consisting of 253,937,877 people shows no correlation between the proportion of Immigrants from Hong Kong and unemployment in the United States with a correlation coefficient (R) of 0.045 and weighted average of 5.2%, a difference of 71.7%.
Unemployment Correlation Summary
| Measurement | Tohono O'odham | Immigrants from Hong Kong |
| Minimum | 2.4% | 0.80% |
| Maximum | 71.4% | 10.7% |
| Range | 69.0% | 9.9% |
| Mean | 17.2% | 5.0% |
| Median | 11.8% | 4.9% |
| Interquartile 25% (IQ1) | 6.4% | 4.4% |
| Interquartile 75% (IQ3) | 16.1% | 5.6% |
| Interquartile Range (IQR) | 9.7% | 1.2% |
| Standard Deviation (Sample) | 17.8% | 1.5% |
| Standard Deviation (Population) | 17.5% | 1.5% |
Similar Demographics by Unemployment
Demographics Similar to Tohono O'odham by Unemployment
In terms of unemployment, the demographic groups most similar to Tohono O'odham are Hopi (8.9%, a difference of 0.45%), Yuman (9.1%, a difference of 2.1%), Puerto Rican (8.4%, a difference of 5.4%), Navajo (8.4%, a difference of 6.3%), and Pima (8.2%, a difference of 7.9%).
| Demographics | Rating | Rank | Unemployment |
| Immigrants | Dominican Republic | 0.0 /100 | #333 | Tragic 7.4% |
| Apache | 0.0 /100 | #334 | Tragic 7.4% |
| Alaskan Athabascans | 0.0 /100 | #335 | Tragic 7.7% |
| Immigrants | Yemen | 0.0 /100 | #336 | Tragic 7.7% |
| Cheyenne | 0.0 /100 | #337 | Tragic 8.0% |
| Pima | 0.0 /100 | #338 | Tragic 8.2% |
| Navajo | 0.0 /100 | #339 | Tragic 8.4% |
| Puerto Ricans | 0.0 /100 | #340 | Tragic 8.4% |
| Tohono O'odham | 0.0 /100 | #341 | Tragic 8.9% |
| Hopi | 0.0 /100 | #342 | Tragic 8.9% |
| Yuman | 0.0 /100 | #343 | Tragic 9.1% |
| Arapaho | 0.0 /100 | #344 | Tragic 9.8% |
| Inupiat | 0.0 /100 | #345 | Tragic 10.1% |
| Crow | 0.0 /100 | #346 | Tragic 11.1% |
| Yup'ik | 0.0 /100 | #347 | Tragic 13.6% |
Demographics Similar to Immigrants from Hong Kong by Unemployment
In terms of unemployment, the demographic groups most similar to Immigrants from Hong Kong are Egyptian (5.2%, a difference of 0.0%), Immigrants from Eastern Europe (5.2%, a difference of 0.010%), Immigrants from China (5.2%, a difference of 0.040%), Potawatomi (5.2%, a difference of 0.080%), and Syrian (5.2%, a difference of 0.22%).
| Demographics | Rating | Rank | Unemployment |
| Immigrants | Norway | 81.8 /100 | #145 | Excellent 5.1% |
| Immigrants | Asia | 81.8 /100 | #146 | Excellent 5.1% |
| Indians (Asian) | 81.6 /100 | #147 | Excellent 5.1% |
| Immigrants | Italy | 79.1 /100 | #148 | Good 5.1% |
| Syrians | 77.7 /100 | #149 | Good 5.2% |
| Potawatomi | 76.2 /100 | #150 | Good 5.2% |
| Immigrants | Eastern Europe | 75.3 /100 | #151 | Good 5.2% |
| Immigrants | Hong Kong | 75.2 /100 | #152 | Good 5.2% |
| Egyptians | 75.2 /100 | #153 | Good 5.2% |
| Immigrants | China | 74.7 /100 | #154 | Good 5.2% |
| Immigrants | Northern Africa | 71.3 /100 | #155 | Good 5.2% |
| Immigrants | Kazakhstan | 70.4 /100 | #156 | Good 5.2% |
| Sri Lankans | 69.5 /100 | #157 | Good 5.2% |
| Immigrants | Egypt | 66.7 /100 | #158 | Good 5.2% |
| Immigrants | Russia | 66.6 /100 | #159 | Good 5.2% |