Shoshone vs French Unemployment
COMPARE
Shoshone
French
Unemployment
Unemployment Comparison
Shoshone
French
6.8%
UNEMPLOYMENT
0.0/ 100
METRIC RATING
317th/ 347
METRIC RANK
4.8%
UNEMPLOYMENT
99.5/ 100
METRIC RATING
45th/ 347
METRIC RANK
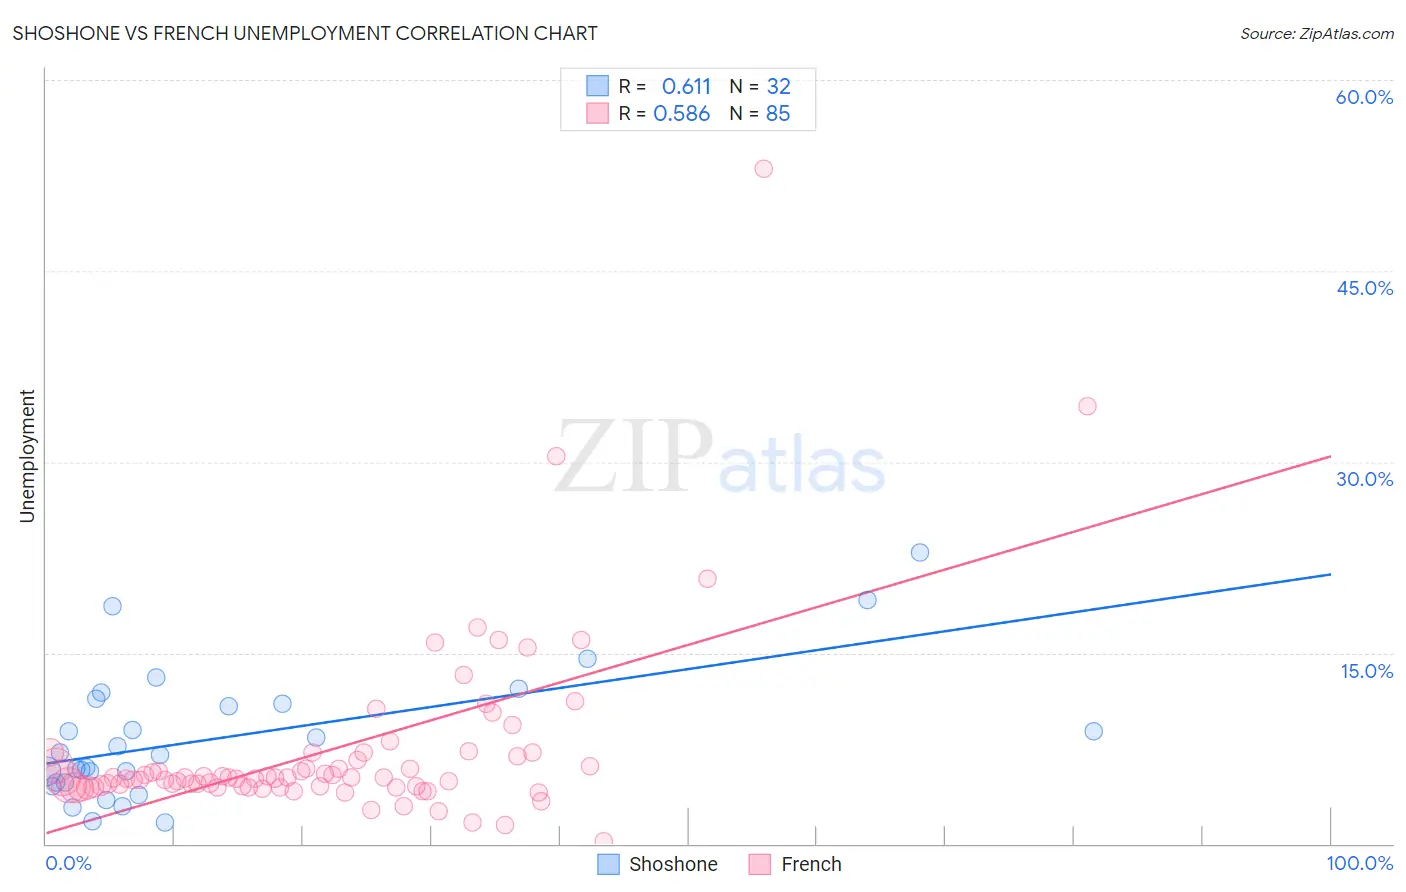
Shoshone vs French Unemployment Correlation Chart
The statistical analysis conducted on geographies consisting of 66,583,051 people shows a significant positive correlation between the proportion of Shoshone and unemployment in the United States with a correlation coefficient (R) of 0.611 and weighted average of 6.8%. Similarly, the statistical analysis conducted on geographies consisting of 568,292,844 people shows a substantial positive correlation between the proportion of French and unemployment in the United States with a correlation coefficient (R) of 0.586 and weighted average of 4.8%, a difference of 40.2%.
Unemployment Correlation Summary
| Measurement | Shoshone | French |
| Minimum | 1.7% | 0.20% |
| Maximum | 22.9% | 53.0% |
| Range | 21.2% | 52.8% |
| Mean | 8.4% | 7.4% |
| Median | 7.1% | 5.2% |
| Interquartile 25% (IQ1) | 4.8% | 4.5% |
| Interquartile 75% (IQ3) | 11.2% | 7.0% |
| Interquartile Range (IQR) | 6.4% | 2.5% |
| Standard Deviation (Sample) | 5.1% | 7.3% |
| Standard Deviation (Population) | 5.1% | 7.3% |
Similar Demographics by Unemployment
Demographics Similar to Shoshone by Unemployment
In terms of unemployment, the demographic groups most similar to Shoshone are Immigrants from Dominica (6.7%, a difference of 0.58%), Immigrants from Cabo Verde (6.8%, a difference of 0.60%), British West Indian (6.8%, a difference of 0.81%), Houma (6.7%, a difference of 1.4%), and Immigrants from St. Vincent and the Grenadines (6.9%, a difference of 1.6%).
| Demographics | Rating | Rank | Unemployment |
| Immigrants | Belize | 0.0 /100 | #310 | Tragic 6.5% |
| Cape Verdeans | 0.0 /100 | #311 | Tragic 6.5% |
| Colville | 0.0 /100 | #312 | Tragic 6.6% |
| Immigrants | Barbados | 0.0 /100 | #313 | Tragic 6.6% |
| Blacks/African Americans | 0.0 /100 | #314 | Tragic 6.6% |
| Houma | 0.0 /100 | #315 | Tragic 6.7% |
| Immigrants | Dominica | 0.0 /100 | #316 | Tragic 6.7% |
| Shoshone | 0.0 /100 | #317 | Tragic 6.8% |
| Immigrants | Cabo Verde | 0.0 /100 | #318 | Tragic 6.8% |
| British West Indians | 0.0 /100 | #319 | Tragic 6.8% |
| Immigrants | St. Vincent and the Grenadines | 0.0 /100 | #320 | Tragic 6.9% |
| Immigrants | Guyana | 0.0 /100 | #321 | Tragic 6.9% |
| Guyanese | 0.0 /100 | #322 | Tragic 6.9% |
| Immigrants | Grenada | 0.0 /100 | #323 | Tragic 6.9% |
| Immigrants | Armenia | 0.0 /100 | #324 | Tragic 7.0% |
Demographics Similar to French by Unemployment
In terms of unemployment, the demographic groups most similar to French are Austrian (4.8%, a difference of 0.050%), Yugoslavian (4.8%, a difference of 0.11%), Immigrants from Nepal (4.8%, a difference of 0.16%), Immigrants from Taiwan (4.8%, a difference of 0.18%), and Filipino (4.8%, a difference of 0.31%).
| Demographics | Rating | Rank | Unemployment |
| Bolivians | 99.7 /100 | #38 | Exceptional 4.8% |
| Lithuanians | 99.7 /100 | #39 | Exceptional 4.8% |
| Northern Europeans | 99.7 /100 | #40 | Exceptional 4.8% |
| Immigrants | Bosnia and Herzegovina | 99.7 /100 | #41 | Exceptional 4.8% |
| Filipinos | 99.5 /100 | #42 | Exceptional 4.8% |
| Yugoslavians | 99.5 /100 | #43 | Exceptional 4.8% |
| Austrians | 99.5 /100 | #44 | Exceptional 4.8% |
| French | 99.5 /100 | #45 | Exceptional 4.8% |
| Immigrants | Nepal | 99.4 /100 | #46 | Exceptional 4.8% |
| Immigrants | Taiwan | 99.4 /100 | #47 | Exceptional 4.8% |
| Immigrants | Scotland | 99.3 /100 | #48 | Exceptional 4.9% |
| Immigrants | South Central Asia | 99.3 /100 | #49 | Exceptional 4.9% |
| French Canadians | 99.3 /100 | #50 | Exceptional 4.9% |
| Immigrants | Belgium | 99.2 /100 | #51 | Exceptional 4.9% |
| Whites/Caucasians | 99.2 /100 | #52 | Exceptional 4.9% |