Shoshone vs Apache Unemployment
COMPARE
Shoshone
Apache
Unemployment
Unemployment Comparison
Shoshone
Apache
6.8%
UNEMPLOYMENT
0.0/ 100
METRIC RATING
317th/ 347
METRIC RANK
7.4%
UNEMPLOYMENT
0.0/ 100
METRIC RATING
334th/ 347
METRIC RANK
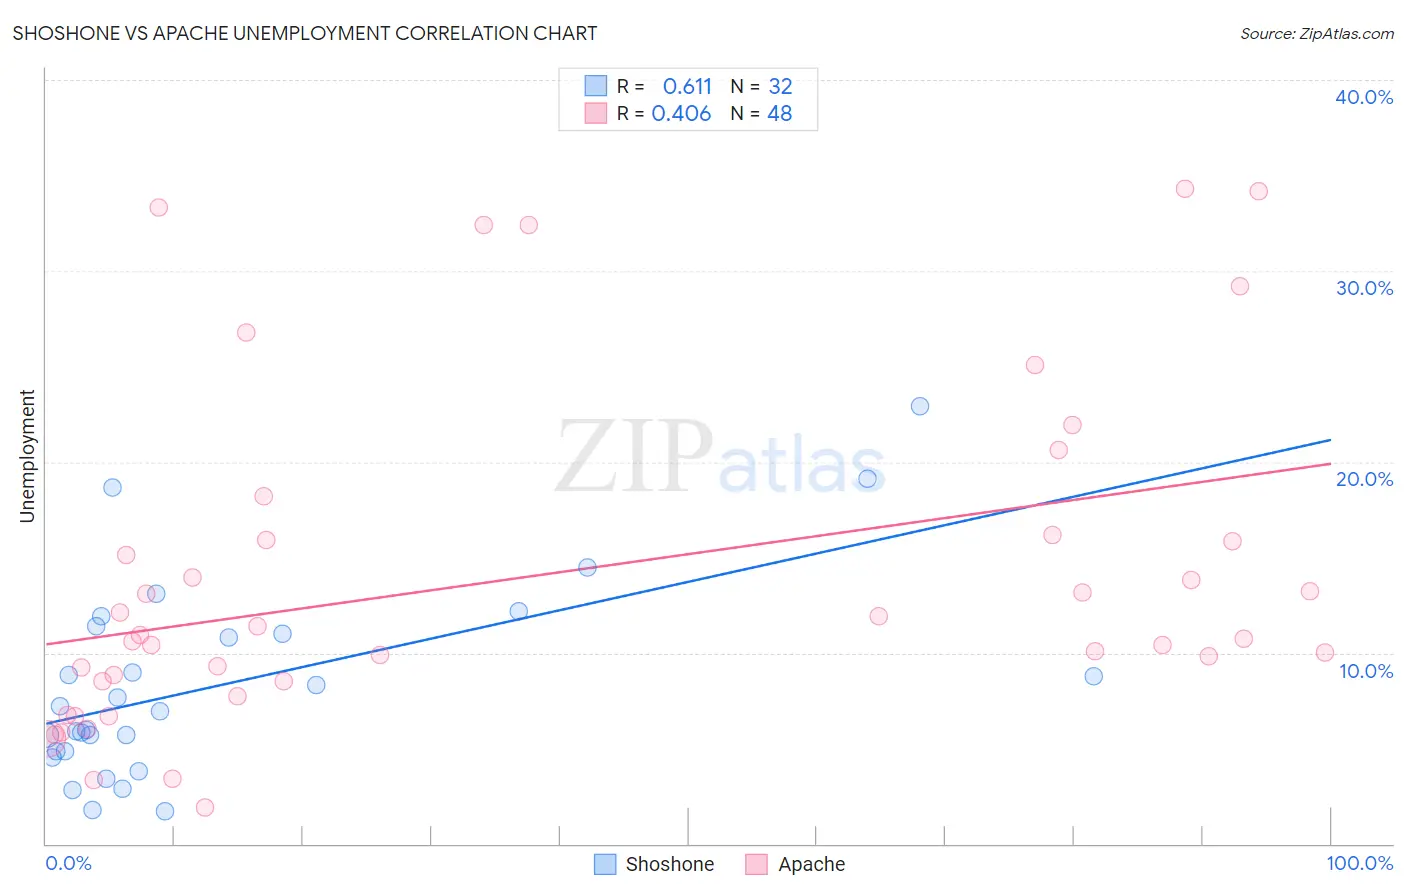
Shoshone vs Apache Unemployment Correlation Chart
The statistical analysis conducted on geographies consisting of 66,583,051 people shows a significant positive correlation between the proportion of Shoshone and unemployment in the United States with a correlation coefficient (R) of 0.611 and weighted average of 6.8%. Similarly, the statistical analysis conducted on geographies consisting of 230,935,623 people shows a moderate positive correlation between the proportion of Apache and unemployment in the United States with a correlation coefficient (R) of 0.406 and weighted average of 7.4%, a difference of 9.6%.
Unemployment Correlation Summary
| Measurement | Shoshone | Apache |
| Minimum | 1.7% | 1.9% |
| Maximum | 22.9% | 34.3% |
| Range | 21.2% | 32.4% |
| Mean | 8.4% | 14.0% |
| Median | 7.1% | 10.8% |
| Interquartile 25% (IQ1) | 4.8% | 8.5% |
| Interquartile 75% (IQ3) | 11.2% | 16.0% |
| Interquartile Range (IQR) | 6.4% | 7.5% |
| Standard Deviation (Sample) | 5.1% | 8.8% |
| Standard Deviation (Population) | 5.1% | 8.7% |
Demographics Similar to Shoshone and Apache by Unemployment
In terms of unemployment, the demographic groups most similar to Shoshone are Immigrants from Dominica (6.7%, a difference of 0.58%), Immigrants from Cabo Verde (6.8%, a difference of 0.60%), British West Indian (6.8%, a difference of 0.81%), Houma (6.7%, a difference of 1.4%), and Immigrants from St. Vincent and the Grenadines (6.9%, a difference of 1.6%). Similarly, the demographic groups most similar to Apache are Immigrants from Dominican Republic (7.4%, a difference of 0.47%), Sioux (7.4%, a difference of 0.53%), Dominican (7.4%, a difference of 0.95%), Yakama (7.3%, a difference of 1.3%), and Alaska Native (7.2%, a difference of 2.6%).
| Demographics | Rating | Rank | Unemployment |
| Houma | 0.0 /100 | #315 | Tragic 6.7% |
| Immigrants | Dominica | 0.0 /100 | #316 | Tragic 6.7% |
| Shoshone | 0.0 /100 | #317 | Tragic 6.8% |
| Immigrants | Cabo Verde | 0.0 /100 | #318 | Tragic 6.8% |
| British West Indians | 0.0 /100 | #319 | Tragic 6.8% |
| Immigrants | St. Vincent and the Grenadines | 0.0 /100 | #320 | Tragic 6.9% |
| Immigrants | Guyana | 0.0 /100 | #321 | Tragic 6.9% |
| Guyanese | 0.0 /100 | #322 | Tragic 6.9% |
| Immigrants | Grenada | 0.0 /100 | #323 | Tragic 6.9% |
| Immigrants | Armenia | 0.0 /100 | #324 | Tragic 7.0% |
| Natives/Alaskans | 0.0 /100 | #325 | Tragic 7.0% |
| Paiute | 0.0 /100 | #326 | Tragic 7.1% |
| Pueblo | 0.0 /100 | #327 | Tragic 7.2% |
| Tsimshian | 0.0 /100 | #328 | Tragic 7.2% |
| Alaska Natives | 0.0 /100 | #329 | Tragic 7.2% |
| Yakama | 0.0 /100 | #330 | Tragic 7.3% |
| Dominicans | 0.0 /100 | #331 | Tragic 7.4% |
| Sioux | 0.0 /100 | #332 | Tragic 7.4% |
| Immigrants | Dominican Republic | 0.0 /100 | #333 | Tragic 7.4% |
| Apache | 0.0 /100 | #334 | Tragic 7.4% |
| Alaskan Athabascans | 0.0 /100 | #335 | Tragic 7.7% |