Shoshone vs Apache Unemployment Among Women with Children Under 18 years
COMPARE
Shoshone
Apache
Unemployment Among Women with Children Under 18 years
Unemployment Among Women with Children Under 18 years Comparison
Shoshone
Apache
6.6%
UNEMPLOYMENT AMONG WOMEN WITH CHILDREN UNDER 18 YEARS
0.0/ 100
METRIC RATING
317th/ 347
METRIC RANK
7.9%
UNEMPLOYMENT AMONG WOMEN WITH CHILDREN UNDER 18 YEARS
0.0/ 100
METRIC RATING
335th/ 347
METRIC RANK
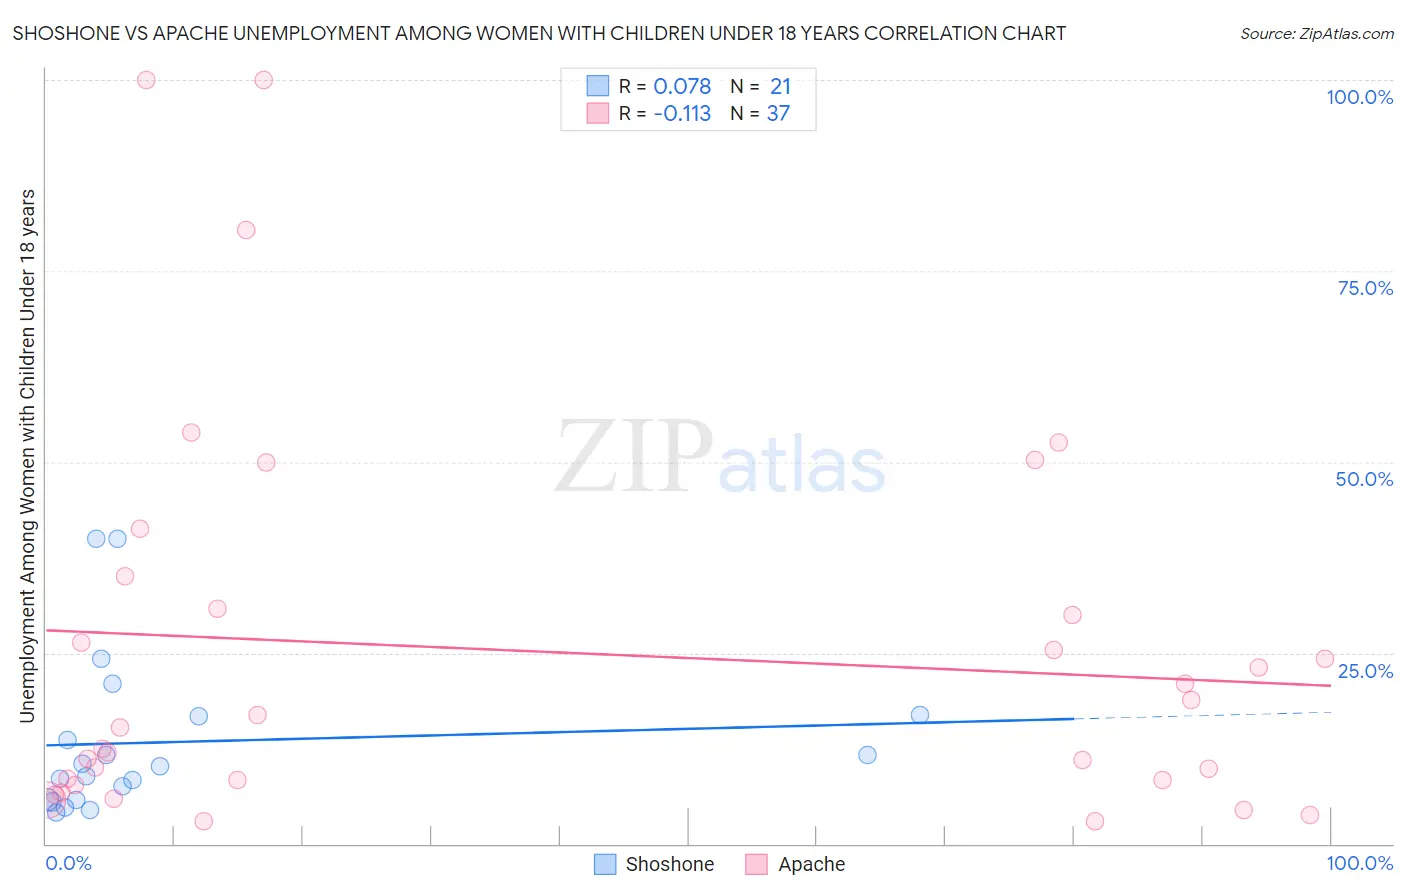
Shoshone vs Apache Unemployment Among Women with Children Under 18 years Correlation Chart
The statistical analysis conducted on geographies consisting of 65,640,123 people shows a slight positive correlation between the proportion of Shoshone and unemployment rate among women with children under the age of 18 in the United States with a correlation coefficient (R) of 0.078 and weighted average of 6.6%. Similarly, the statistical analysis conducted on geographies consisting of 224,768,063 people shows a poor negative correlation between the proportion of Apache and unemployment rate among women with children under the age of 18 in the United States with a correlation coefficient (R) of -0.113 and weighted average of 7.9%, a difference of 19.3%.
Unemployment Among Women with Children Under 18 years Correlation Summary
| Measurement | Shoshone | Apache |
| Minimum | 4.1% | 2.9% |
| Maximum | 40.0% | 100.0% |
| Range | 35.9% | 97.1% |
| Mean | 13.3% | 25.2% |
| Median | 10.2% | 15.3% |
| Interquartile 25% (IQ1) | 5.7% | 8.1% |
| Interquartile 75% (IQ3) | 16.8% | 33.0% |
| Interquartile Range (IQR) | 11.1% | 24.9% |
| Standard Deviation (Sample) | 10.4% | 25.5% |
| Standard Deviation (Population) | 10.1% | 25.1% |
Demographics Similar to Shoshone and Apache by Unemployment Among Women with Children Under 18 years
In terms of unemployment among women with children under 18 years, the demographic groups most similar to Shoshone are Immigrants from Ecuador (6.6%, a difference of 0.040%), Alaska Native (6.7%, a difference of 0.29%), Central American Indian (6.7%, a difference of 0.53%), Immigrants from Belize (6.7%, a difference of 0.62%), and U.S. Virgin Islander (6.7%, a difference of 0.68%). Similarly, the demographic groups most similar to Apache are Sioux (7.9%, a difference of 0.30%), Cheyenne (7.8%, a difference of 0.98%), Immigrants from Dominican Republic (7.5%, a difference of 5.7%), Dominican (7.5%, a difference of 6.0%), and Hopi (7.4%, a difference of 6.6%).
| Demographics | Rating | Rank | Unemployment Among Women with Children Under 18 years |
| Immigrants | Ecuador | 0.0 /100 | #316 | Tragic 6.6% |
| Shoshone | 0.0 /100 | #317 | Tragic 6.6% |
| Alaska Natives | 0.0 /100 | #318 | Tragic 6.7% |
| Central American Indians | 0.0 /100 | #319 | Tragic 6.7% |
| Immigrants | Belize | 0.0 /100 | #320 | Tragic 6.7% |
| U.S. Virgin Islanders | 0.0 /100 | #321 | Tragic 6.7% |
| Houma | 0.0 /100 | #322 | Tragic 6.8% |
| Pueblo | 0.0 /100 | #323 | Tragic 6.8% |
| Paiute | 0.0 /100 | #324 | Tragic 6.9% |
| Immigrants | Dominica | 0.0 /100 | #325 | Tragic 7.0% |
| Chippewa | 0.0 /100 | #326 | Tragic 7.0% |
| Lumbee | 0.0 /100 | #327 | Tragic 7.1% |
| Natives/Alaskans | 0.0 /100 | #328 | Tragic 7.2% |
| Blacks/African Americans | 0.0 /100 | #329 | Tragic 7.3% |
| Colville | 0.0 /100 | #330 | Tragic 7.4% |
| Hopi | 0.0 /100 | #331 | Tragic 7.4% |
| Dominicans | 0.0 /100 | #332 | Tragic 7.5% |
| Immigrants | Dominican Republic | 0.0 /100 | #333 | Tragic 7.5% |
| Cheyenne | 0.0 /100 | #334 | Tragic 7.8% |
| Apache | 0.0 /100 | #335 | Tragic 7.9% |
| Sioux | 0.0 /100 | #336 | Tragic 7.9% |