Asian vs Apache Unemployment
COMPARE
Asian
Apache
Unemployment
Unemployment Comparison
Asians
Apache
5.1%
UNEMPLOYMENT
89.0/ 100
METRIC RATING
123rd/ 347
METRIC RANK
7.4%
UNEMPLOYMENT
0.0/ 100
METRIC RATING
334th/ 347
METRIC RANK
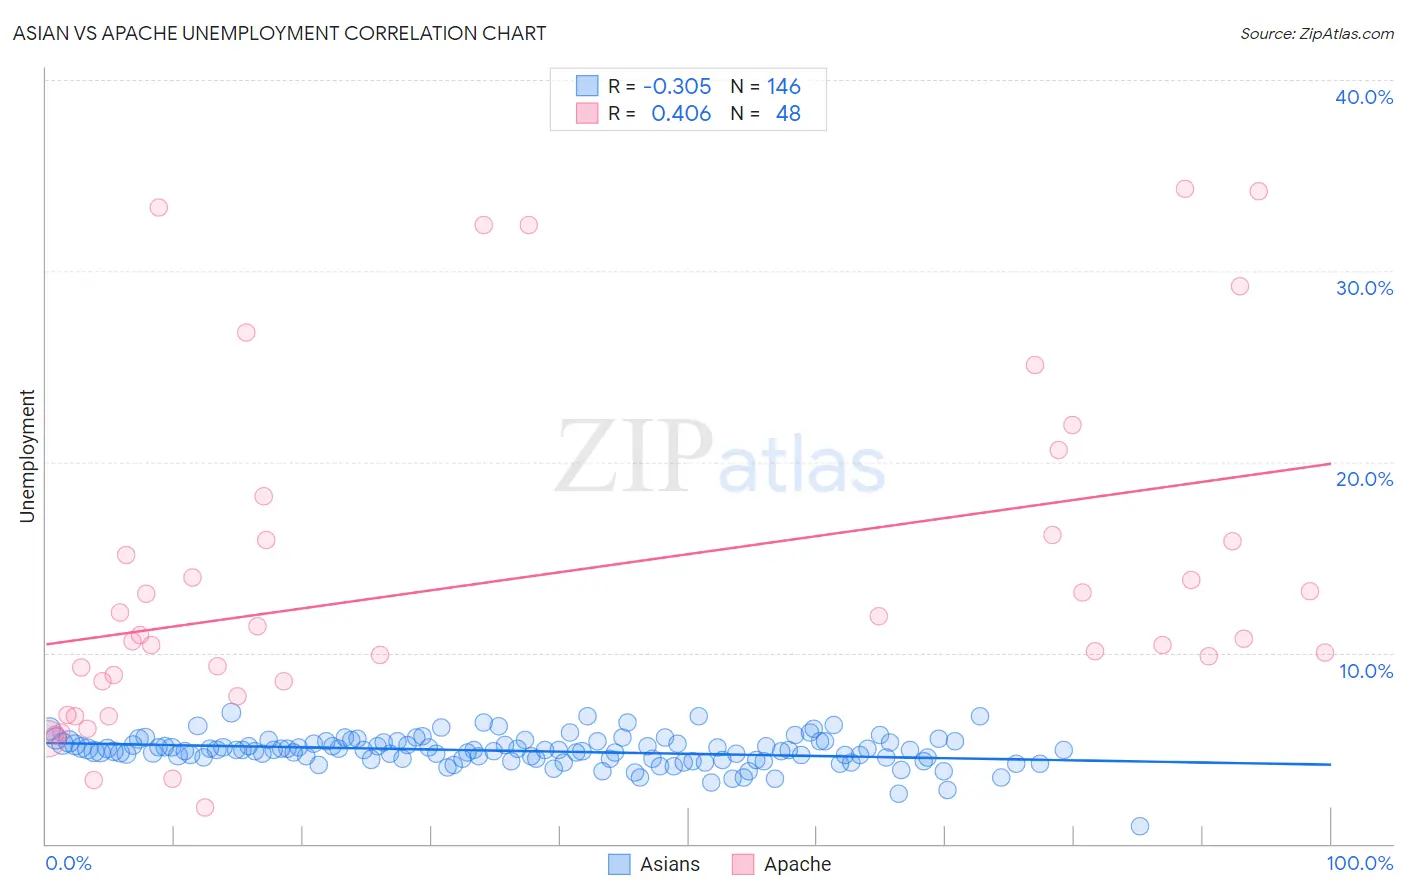
Asian vs Apache Unemployment Correlation Chart
The statistical analysis conducted on geographies consisting of 548,726,381 people shows a mild negative correlation between the proportion of Asians and unemployment in the United States with a correlation coefficient (R) of -0.305 and weighted average of 5.1%. Similarly, the statistical analysis conducted on geographies consisting of 230,935,623 people shows a moderate positive correlation between the proportion of Apache and unemployment in the United States with a correlation coefficient (R) of 0.406 and weighted average of 7.4%, a difference of 46.0%.
Unemployment Correlation Summary
| Measurement | Asian | Apache |
| Minimum | 0.90% | 1.9% |
| Maximum | 6.9% | 34.3% |
| Range | 6.0% | 32.4% |
| Mean | 4.9% | 14.0% |
| Median | 4.9% | 10.8% |
| Interquartile 25% (IQ1) | 4.5% | 8.5% |
| Interquartile 75% (IQ3) | 5.3% | 16.0% |
| Interquartile Range (IQR) | 0.84% | 7.5% |
| Standard Deviation (Sample) | 0.81% | 8.8% |
| Standard Deviation (Population) | 0.81% | 8.7% |
Similar Demographics by Unemployment
Demographics Similar to Asians by Unemployment
In terms of unemployment, the demographic groups most similar to Asians are Immigrants from Switzerland (5.1%, a difference of 0.020%), Lebanese (5.1%, a difference of 0.040%), Ethiopian (5.1%, a difference of 0.050%), Immigrants from Eastern Asia (5.1%, a difference of 0.10%), and Macedonian (5.1%, a difference of 0.11%).
| Demographics | Rating | Rank | Unemployment |
| Immigrants | Sri Lanka | 91.1 /100 | #116 | Exceptional 5.1% |
| Immigrants | Malaysia | 91.0 /100 | #117 | Exceptional 5.1% |
| Immigrants | Germany | 90.8 /100 | #118 | Exceptional 5.1% |
| Immigrants | France | 89.7 /100 | #119 | Excellent 5.1% |
| Macedonians | 89.7 /100 | #120 | Excellent 5.1% |
| Lebanese | 89.2 /100 | #121 | Excellent 5.1% |
| Immigrants | Switzerland | 89.1 /100 | #122 | Excellent 5.1% |
| Asians | 89.0 /100 | #123 | Excellent 5.1% |
| Ethiopians | 88.6 /100 | #124 | Excellent 5.1% |
| Immigrants | Eastern Asia | 88.3 /100 | #125 | Excellent 5.1% |
| Kenyans | 88.2 /100 | #126 | Excellent 5.1% |
| Immigrants | Kenya | 88.2 /100 | #127 | Excellent 5.1% |
| Immigrants | Eastern Africa | 88.1 /100 | #128 | Excellent 5.1% |
| Immigrants | Latvia | 88.0 /100 | #129 | Excellent 5.1% |
| Iranians | 86.9 /100 | #130 | Excellent 5.1% |
Demographics Similar to Apache by Unemployment
In terms of unemployment, the demographic groups most similar to Apache are Immigrants from Dominican Republic (7.4%, a difference of 0.47%), Sioux (7.4%, a difference of 0.53%), Dominican (7.4%, a difference of 0.95%), Yakama (7.3%, a difference of 1.3%), and Alaska Native (7.2%, a difference of 2.6%).
| Demographics | Rating | Rank | Unemployment |
| Pueblo | 0.0 /100 | #327 | Tragic 7.2% |
| Tsimshian | 0.0 /100 | #328 | Tragic 7.2% |
| Alaska Natives | 0.0 /100 | #329 | Tragic 7.2% |
| Yakama | 0.0 /100 | #330 | Tragic 7.3% |
| Dominicans | 0.0 /100 | #331 | Tragic 7.4% |
| Sioux | 0.0 /100 | #332 | Tragic 7.4% |
| Immigrants | Dominican Republic | 0.0 /100 | #333 | Tragic 7.4% |
| Apache | 0.0 /100 | #334 | Tragic 7.4% |
| Alaskan Athabascans | 0.0 /100 | #335 | Tragic 7.7% |
| Immigrants | Yemen | 0.0 /100 | #336 | Tragic 7.7% |
| Cheyenne | 0.0 /100 | #337 | Tragic 8.0% |
| Pima | 0.0 /100 | #338 | Tragic 8.2% |
| Navajo | 0.0 /100 | #339 | Tragic 8.4% |
| Puerto Ricans | 0.0 /100 | #340 | Tragic 8.4% |
| Tohono O'odham | 0.0 /100 | #341 | Tragic 8.9% |