Immigrants from Albania vs Apache Unemployment
COMPARE
Immigrants from Albania
Apache
Unemployment
Unemployment Comparison
Immigrants from Albania
Apache
5.4%
UNEMPLOYMENT
13.5/ 100
METRIC RATING
217th/ 347
METRIC RANK
7.4%
UNEMPLOYMENT
0.0/ 100
METRIC RATING
334th/ 347
METRIC RANK
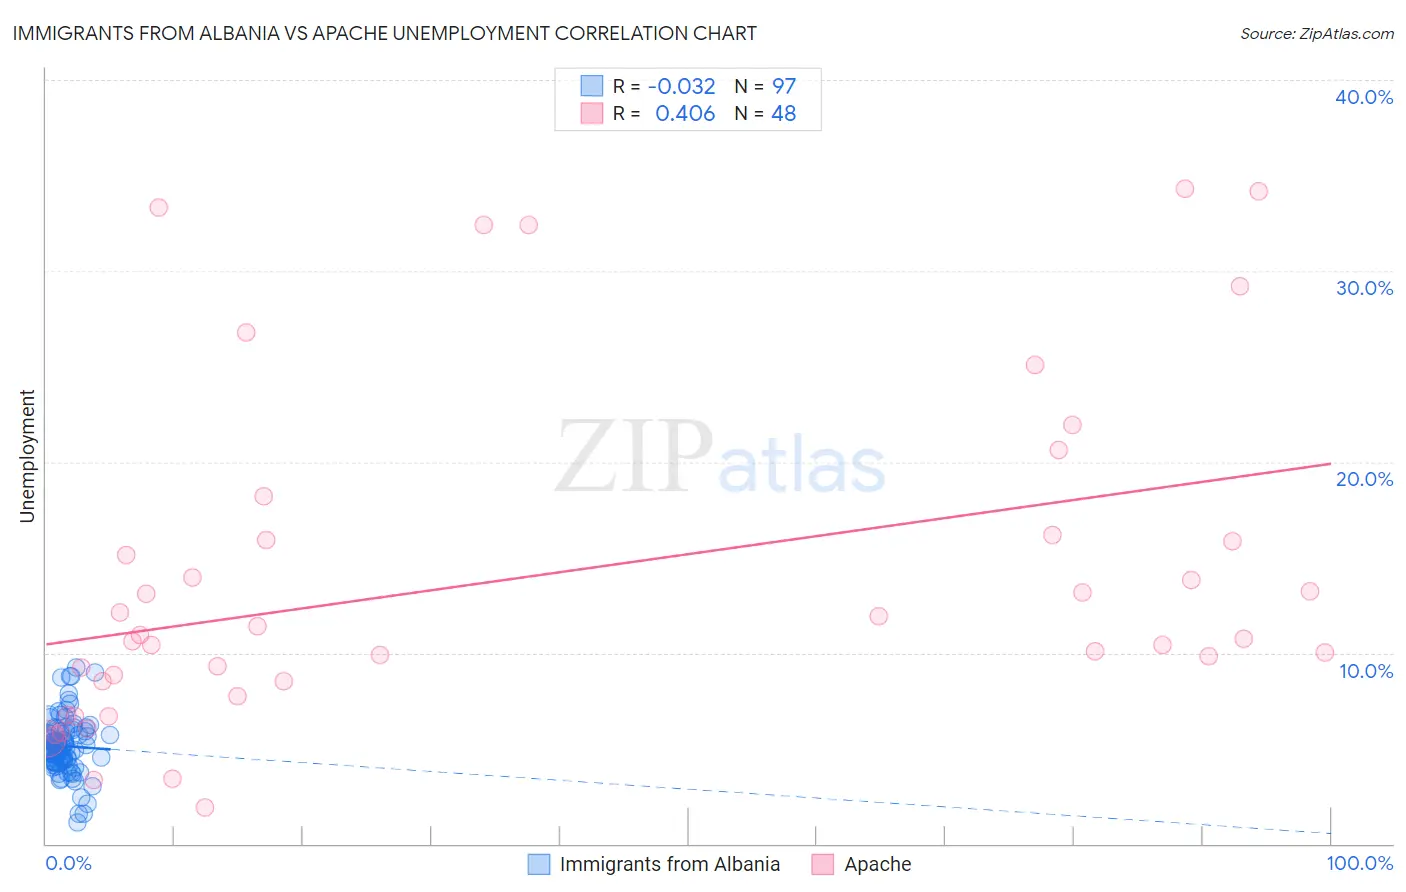
Immigrants from Albania vs Apache Unemployment Correlation Chart
The statistical analysis conducted on geographies consisting of 119,392,247 people shows no correlation between the proportion of Immigrants from Albania and unemployment in the United States with a correlation coefficient (R) of -0.032 and weighted average of 5.4%. Similarly, the statistical analysis conducted on geographies consisting of 230,935,623 people shows a moderate positive correlation between the proportion of Apache and unemployment in the United States with a correlation coefficient (R) of 0.406 and weighted average of 7.4%, a difference of 37.3%.
Unemployment Correlation Summary
| Measurement | Immigrants from Albania | Apache |
| Minimum | 1.1% | 1.9% |
| Maximum | 9.2% | 34.3% |
| Range | 8.1% | 32.4% |
| Mean | 5.1% | 14.0% |
| Median | 5.0% | 10.8% |
| Interquartile 25% (IQ1) | 4.3% | 8.5% |
| Interquartile 75% (IQ3) | 5.9% | 16.0% |
| Interquartile Range (IQR) | 1.6% | 7.5% |
| Standard Deviation (Sample) | 1.5% | 8.8% |
| Standard Deviation (Population) | 1.5% | 8.7% |
Similar Demographics by Unemployment
Demographics Similar to Immigrants from Albania by Unemployment
In terms of unemployment, the demographic groups most similar to Immigrants from Albania are Immigrants from South America (5.4%, a difference of 0.0%), Choctaw (5.4%, a difference of 0.10%), Delaware (5.4%, a difference of 0.16%), Immigrants from Middle Africa (5.4%, a difference of 0.22%), and Immigrants from Costa Rica (5.4%, a difference of 0.22%).
| Demographics | Rating | Rank | Unemployment |
| Immigrants | Iraq | 18.6 /100 | #210 | Poor 5.4% |
| Iraqis | 18.1 /100 | #211 | Poor 5.4% |
| Ugandans | 18.0 /100 | #212 | Poor 5.4% |
| Immigrants | Middle Africa | 15.3 /100 | #213 | Poor 5.4% |
| Immigrants | Costa Rica | 15.2 /100 | #214 | Poor 5.4% |
| Delaware | 14.7 /100 | #215 | Poor 5.4% |
| Immigrants | South America | 13.5 /100 | #216 | Poor 5.4% |
| Immigrants | Albania | 13.5 /100 | #217 | Poor 5.4% |
| Choctaw | 12.7 /100 | #218 | Poor 5.4% |
| Bangladeshis | 11.2 /100 | #219 | Poor 5.4% |
| Soviet Union | 10.6 /100 | #220 | Poor 5.4% |
| Immigrants | Philippines | 10.4 /100 | #221 | Poor 5.4% |
| Iroquois | 10.3 /100 | #222 | Poor 5.4% |
| Seminole | 9.2 /100 | #223 | Tragic 5.4% |
| Israelis | 8.8 /100 | #224 | Tragic 5.4% |
Demographics Similar to Apache by Unemployment
In terms of unemployment, the demographic groups most similar to Apache are Immigrants from Dominican Republic (7.4%, a difference of 0.47%), Sioux (7.4%, a difference of 0.53%), Dominican (7.4%, a difference of 0.95%), Yakama (7.3%, a difference of 1.3%), and Alaska Native (7.2%, a difference of 2.6%).
| Demographics | Rating | Rank | Unemployment |
| Pueblo | 0.0 /100 | #327 | Tragic 7.2% |
| Tsimshian | 0.0 /100 | #328 | Tragic 7.2% |
| Alaska Natives | 0.0 /100 | #329 | Tragic 7.2% |
| Yakama | 0.0 /100 | #330 | Tragic 7.3% |
| Dominicans | 0.0 /100 | #331 | Tragic 7.4% |
| Sioux | 0.0 /100 | #332 | Tragic 7.4% |
| Immigrants | Dominican Republic | 0.0 /100 | #333 | Tragic 7.4% |
| Apache | 0.0 /100 | #334 | Tragic 7.4% |
| Alaskan Athabascans | 0.0 /100 | #335 | Tragic 7.7% |
| Immigrants | Yemen | 0.0 /100 | #336 | Tragic 7.7% |
| Cheyenne | 0.0 /100 | #337 | Tragic 8.0% |
| Pima | 0.0 /100 | #338 | Tragic 8.2% |
| Navajo | 0.0 /100 | #339 | Tragic 8.4% |
| Puerto Ricans | 0.0 /100 | #340 | Tragic 8.4% |
| Tohono O'odham | 0.0 /100 | #341 | Tragic 8.9% |