Tongan vs Apache Unemployment
COMPARE
Tongan
Apache
Unemployment
Unemployment Comparison
Tongans
Apache
4.8%
UNEMPLOYMENT
99.7/ 100
METRIC RATING
36th/ 347
METRIC RANK
7.4%
UNEMPLOYMENT
0.0/ 100
METRIC RATING
334th/ 347
METRIC RANK
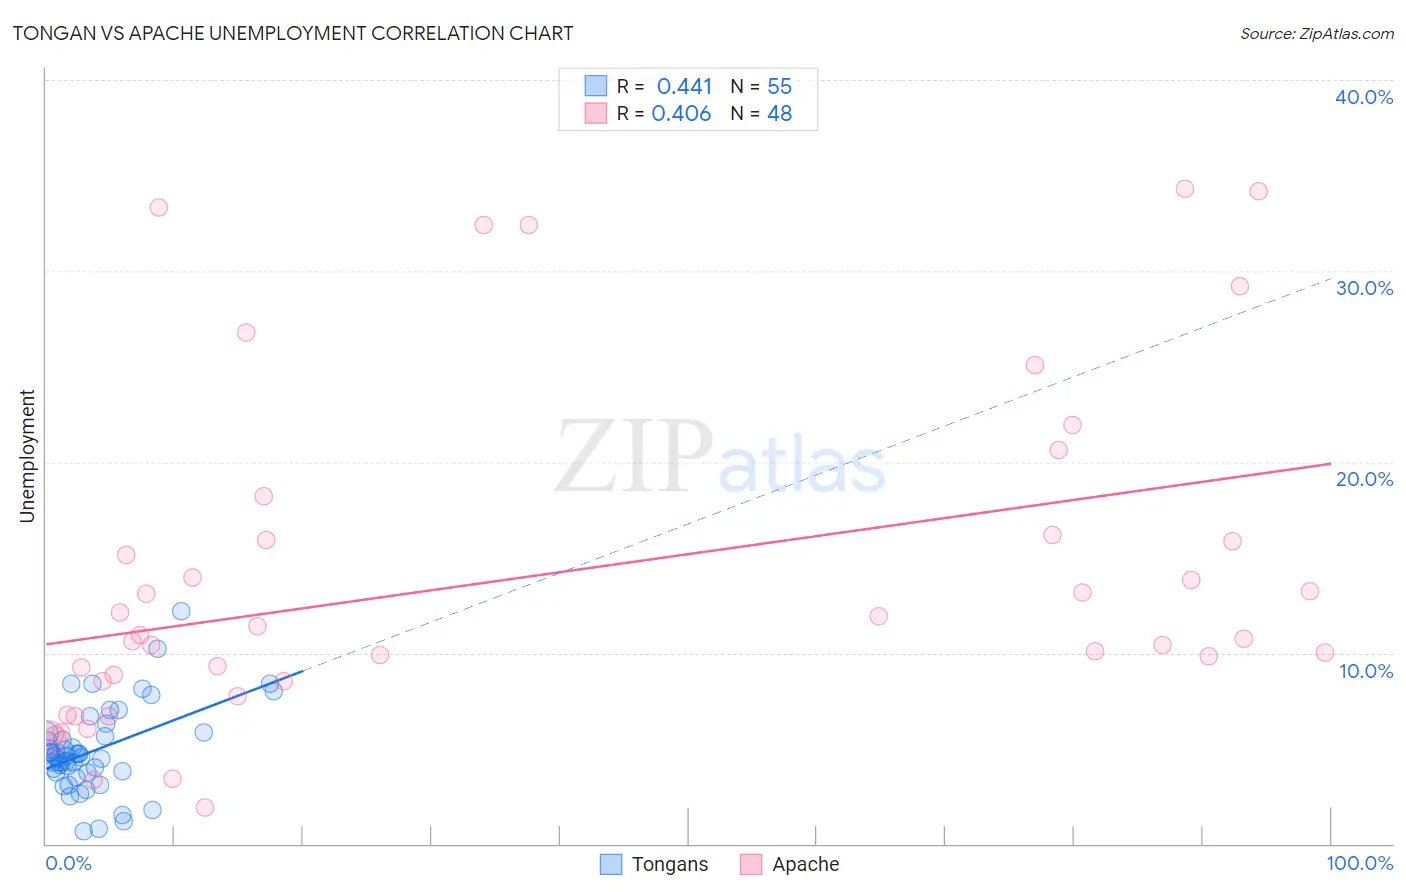
Tongan vs Apache Unemployment Correlation Chart
The statistical analysis conducted on geographies consisting of 102,862,853 people shows a moderate positive correlation between the proportion of Tongans and unemployment in the United States with a correlation coefficient (R) of 0.441 and weighted average of 4.8%. Similarly, the statistical analysis conducted on geographies consisting of 230,935,623 people shows a moderate positive correlation between the proportion of Apache and unemployment in the United States with a correlation coefficient (R) of 0.406 and weighted average of 7.4%, a difference of 55.4%.
Unemployment Correlation Summary
| Measurement | Tongan | Apache |
| Minimum | 0.66% | 1.9% |
| Maximum | 12.2% | 34.3% |
| Range | 11.5% | 32.4% |
| Mean | 4.9% | 14.0% |
| Median | 4.6% | 10.8% |
| Interquartile 25% (IQ1) | 3.7% | 8.5% |
| Interquartile 75% (IQ3) | 5.8% | 16.0% |
| Interquartile Range (IQR) | 2.1% | 7.5% |
| Standard Deviation (Sample) | 2.2% | 8.8% |
| Standard Deviation (Population) | 2.2% | 8.7% |
Similar Demographics by Unemployment
Demographics Similar to Tongans by Unemployment
In terms of unemployment, the demographic groups most similar to Tongans are Czechoslovakian (4.8%, a difference of 0.070%), Scotch-Irish (4.8%, a difference of 0.22%), Bolivian (4.8%, a difference of 0.26%), Immigrants from Bolivia (4.8%, a difference of 0.30%), and Sudanese (4.8%, a difference of 0.33%).
| Demographics | Rating | Rank | Unemployment |
| Poles | 99.8 /100 | #29 | Exceptional 4.7% |
| Irish | 99.8 /100 | #30 | Exceptional 4.8% |
| Croatians | 99.8 /100 | #31 | Exceptional 4.8% |
| Zimbabweans | 99.8 /100 | #32 | Exceptional 4.8% |
| Sudanese | 99.8 /100 | #33 | Exceptional 4.8% |
| Immigrants | Bolivia | 99.8 /100 | #34 | Exceptional 4.8% |
| Scotch-Irish | 99.8 /100 | #35 | Exceptional 4.8% |
| Tongans | 99.7 /100 | #36 | Exceptional 4.8% |
| Czechoslovakians | 99.7 /100 | #37 | Exceptional 4.8% |
| Bolivians | 99.7 /100 | #38 | Exceptional 4.8% |
| Lithuanians | 99.7 /100 | #39 | Exceptional 4.8% |
| Northern Europeans | 99.7 /100 | #40 | Exceptional 4.8% |
| Immigrants | Bosnia and Herzegovina | 99.7 /100 | #41 | Exceptional 4.8% |
| Filipinos | 99.5 /100 | #42 | Exceptional 4.8% |
| Yugoslavians | 99.5 /100 | #43 | Exceptional 4.8% |
Demographics Similar to Apache by Unemployment
In terms of unemployment, the demographic groups most similar to Apache are Immigrants from Dominican Republic (7.4%, a difference of 0.47%), Sioux (7.4%, a difference of 0.53%), Dominican (7.4%, a difference of 0.95%), Yakama (7.3%, a difference of 1.3%), and Alaska Native (7.2%, a difference of 2.6%).
| Demographics | Rating | Rank | Unemployment |
| Pueblo | 0.0 /100 | #327 | Tragic 7.2% |
| Tsimshian | 0.0 /100 | #328 | Tragic 7.2% |
| Alaska Natives | 0.0 /100 | #329 | Tragic 7.2% |
| Yakama | 0.0 /100 | #330 | Tragic 7.3% |
| Dominicans | 0.0 /100 | #331 | Tragic 7.4% |
| Sioux | 0.0 /100 | #332 | Tragic 7.4% |
| Immigrants | Dominican Republic | 0.0 /100 | #333 | Tragic 7.4% |
| Apache | 0.0 /100 | #334 | Tragic 7.4% |
| Alaskan Athabascans | 0.0 /100 | #335 | Tragic 7.7% |
| Immigrants | Yemen | 0.0 /100 | #336 | Tragic 7.7% |
| Cheyenne | 0.0 /100 | #337 | Tragic 8.0% |
| Pima | 0.0 /100 | #338 | Tragic 8.2% |
| Navajo | 0.0 /100 | #339 | Tragic 8.4% |
| Puerto Ricans | 0.0 /100 | #340 | Tragic 8.4% |
| Tohono O'odham | 0.0 /100 | #341 | Tragic 8.9% |