Scotch-Irish vs English Unemployment Among Ages 65 to 74 years
COMPARE
Scotch-Irish
English
Unemployment Among Ages 65 to 74 years
Unemployment Among Ages 65 to 74 years Comparison
Scotch-Irish
English
5.2%
UNEMPLOYMENT AMONG AGES 65 TO 74 YEARS
99.0/ 100
METRIC RATING
71st/ 347
METRIC RANK
5.2%
UNEMPLOYMENT AMONG AGES 65 TO 74 YEARS
97.8/ 100
METRIC RATING
89th/ 347
METRIC RANK
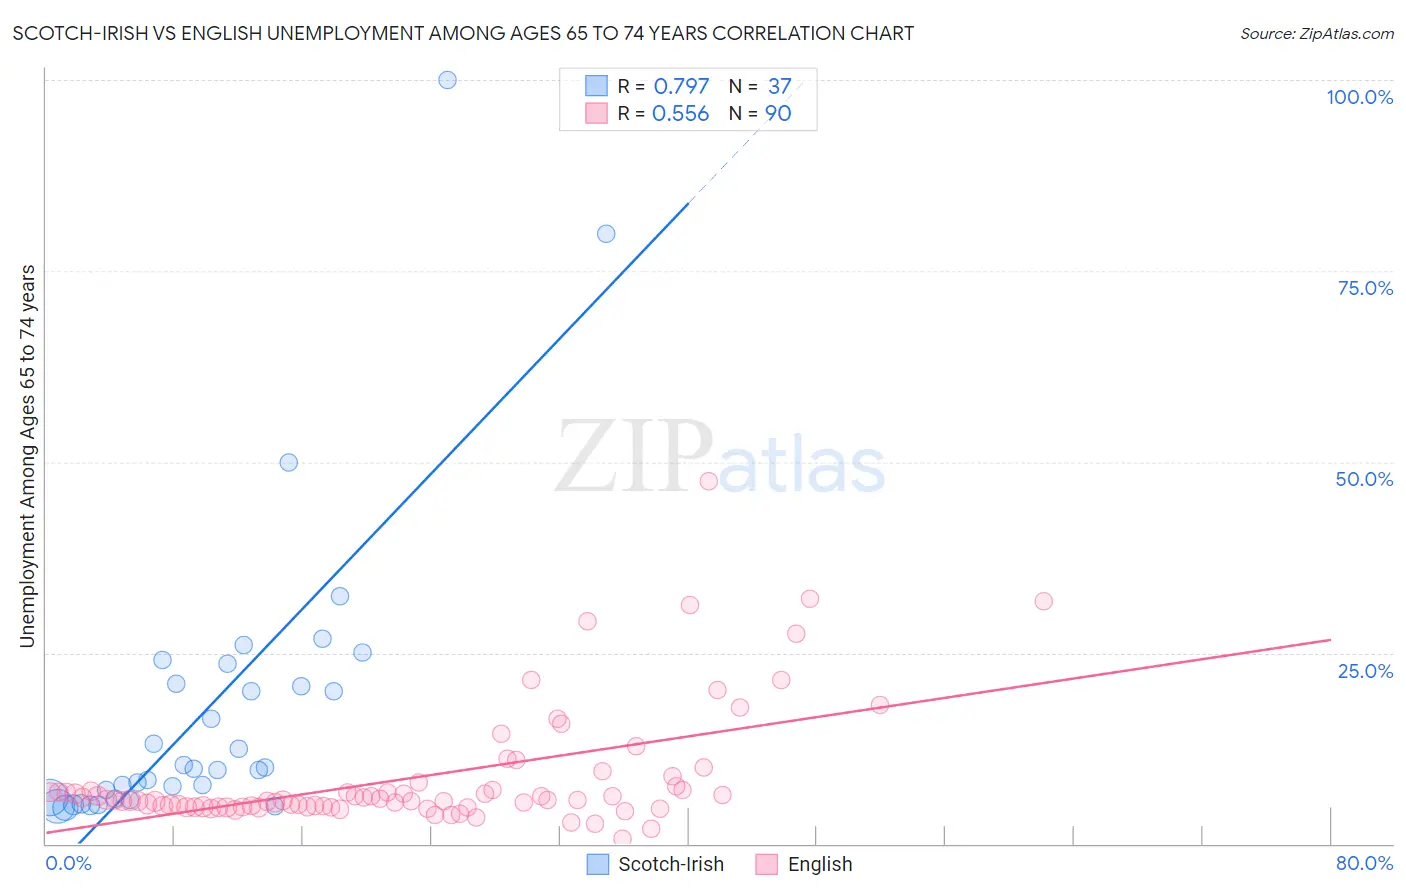
Scotch-Irish vs English Unemployment Among Ages 65 to 74 years Correlation Chart
The statistical analysis conducted on geographies consisting of 431,743,679 people shows a strong positive correlation between the proportion of Scotch-Irish and unemployment rate among population between the ages 65 and 74 in the United States with a correlation coefficient (R) of 0.797 and weighted average of 5.2%. Similarly, the statistical analysis conducted on geographies consisting of 447,132,305 people shows a substantial positive correlation between the proportion of English and unemployment rate among population between the ages 65 and 74 in the United States with a correlation coefficient (R) of 0.556 and weighted average of 5.2%, a difference of 0.68%.
Unemployment Among Ages 65 to 74 years Correlation Summary
| Measurement | Scotch-Irish | English |
| Minimum | 4.7% | 0.65% |
| Maximum | 100.0% | 47.5% |
| Range | 95.3% | 46.8% |
| Mean | 17.8% | 8.7% |
| Median | 9.8% | 5.7% |
| Interquartile 25% (IQ1) | 6.0% | 4.9% |
| Interquartile 75% (IQ3) | 22.2% | 7.1% |
| Interquartile Range (IQR) | 16.3% | 2.2% |
| Standard Deviation (Sample) | 20.2% | 7.9% |
| Standard Deviation (Population) | 19.9% | 7.9% |
Demographics Similar to Scotch-Irish and English by Unemployment Among Ages 65 to 74 years
In terms of unemployment among ages 65 to 74 years, the demographic groups most similar to Scotch-Irish are Immigrants from Oceania (5.2%, a difference of 0.010%), Filipino (5.2%, a difference of 0.030%), Afghan (5.2%, a difference of 0.040%), Okinawan (5.2%, a difference of 0.050%), and Estonian (5.2%, a difference of 0.050%). Similarly, the demographic groups most similar to English are Immigrants from Saudi Arabia (5.2%, a difference of 0.010%), Danish (5.2%, a difference of 0.020%), Scottish (5.2%, a difference of 0.020%), British (5.2%, a difference of 0.030%), and Immigrants from Hungary (5.2%, a difference of 0.070%).
| Demographics | Rating | Rank | Unemployment Among Ages 65 to 74 years |
| Immigrants | Japan | 99.1 /100 | #70 | Exceptional 5.2% |
| Scotch-Irish | 99.0 /100 | #71 | Exceptional 5.2% |
| Immigrants | Oceania | 99.0 /100 | #72 | Exceptional 5.2% |
| Filipinos | 99.0 /100 | #73 | Exceptional 5.2% |
| Afghans | 99.0 /100 | #74 | Exceptional 5.2% |
| Okinawans | 99.0 /100 | #75 | Exceptional 5.2% |
| Estonians | 99.0 /100 | #76 | Exceptional 5.2% |
| Immigrants | Sudan | 98.9 /100 | #77 | Exceptional 5.2% |
| Northern Europeans | 98.9 /100 | #78 | Exceptional 5.2% |
| Slavs | 98.7 /100 | #79 | Exceptional 5.2% |
| Immigrants | South Africa | 98.6 /100 | #80 | Exceptional 5.2% |
| Immigrants | Scotland | 98.6 /100 | #81 | Exceptional 5.2% |
| Thais | 98.6 /100 | #82 | Exceptional 5.2% |
| Immigrants | Middle Africa | 98.4 /100 | #83 | Exceptional 5.2% |
| Immigrants | Hungary | 98.0 /100 | #84 | Exceptional 5.2% |
| British | 97.9 /100 | #85 | Exceptional 5.2% |
| Danes | 97.9 /100 | #86 | Exceptional 5.2% |
| Scottish | 97.9 /100 | #87 | Exceptional 5.2% |
| Immigrants | Saudi Arabia | 97.9 /100 | #88 | Exceptional 5.2% |
| English | 97.8 /100 | #89 | Exceptional 5.2% |
| Luxembourgers | 97.6 /100 | #90 | Exceptional 5.2% |