Scotch-Irish vs Immigrants from Burma/Myanmar Unemployment Among Ages 55 to 59 years
COMPARE
Scotch-Irish
Immigrants from Burma/Myanmar
Unemployment Among Ages 55 to 59 years
Unemployment Among Ages 55 to 59 years Comparison
Scotch-Irish
Immigrants from Burma/Myanmar
4.6%
UNEMPLOYMENT AMONG AGES 55 TO 59 YEARS
98.3/ 100
METRIC RATING
77th/ 347
METRIC RANK
4.4%
UNEMPLOYMENT AMONG AGES 55 TO 59 YEARS
100.0/ 100
METRIC RATING
22nd/ 347
METRIC RANK
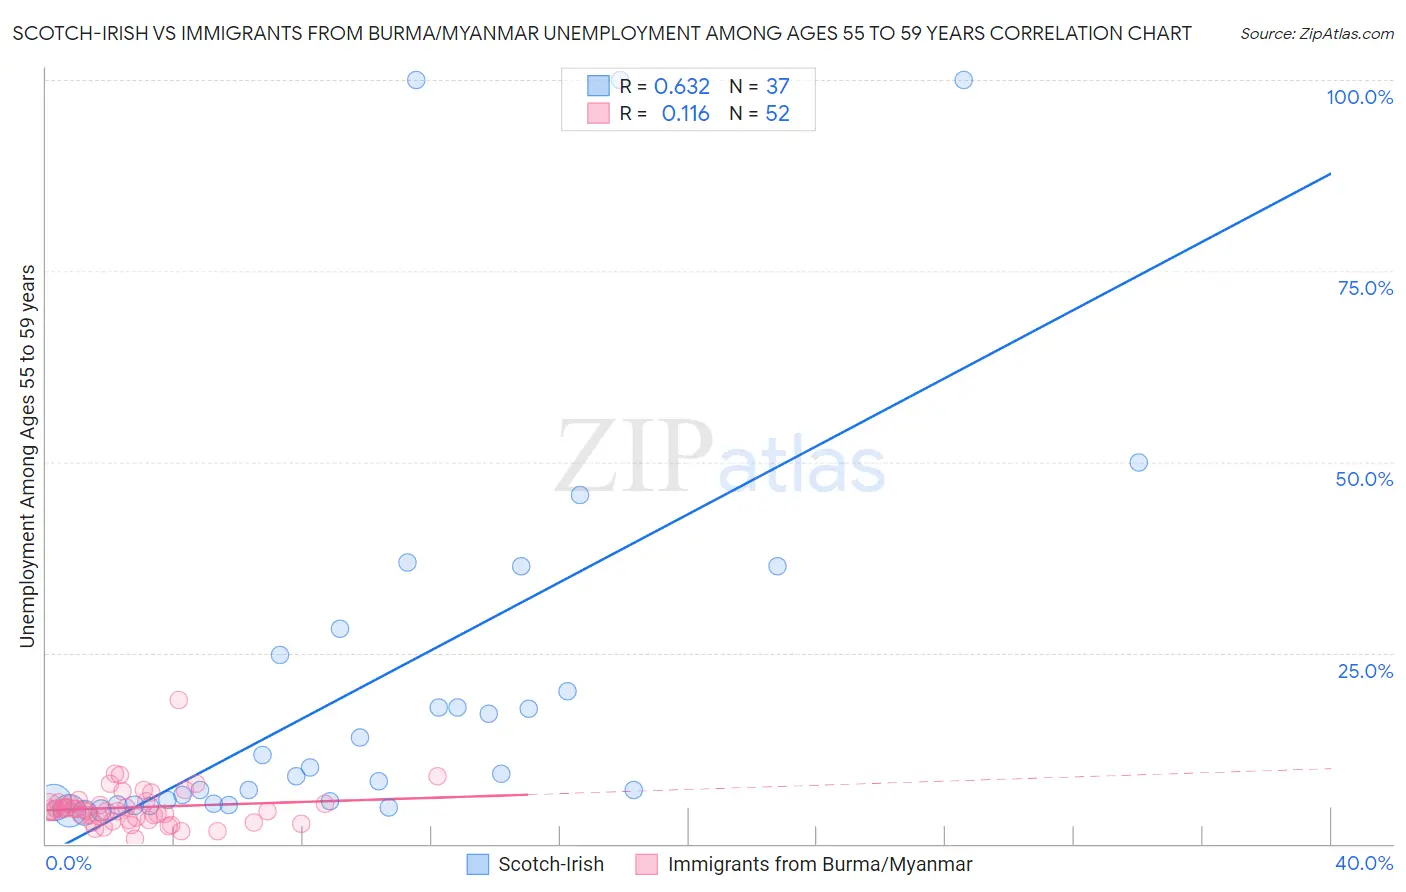
Scotch-Irish vs Immigrants from Burma/Myanmar Unemployment Among Ages 55 to 59 years Correlation Chart
The statistical analysis conducted on geographies consisting of 470,743,617 people shows a significant positive correlation between the proportion of Scotch-Irish and unemployment rate among population between the ages 55 and 59 in the United States with a correlation coefficient (R) of 0.632 and weighted average of 4.6%. Similarly, the statistical analysis conducted on geographies consisting of 167,911,825 people shows a poor positive correlation between the proportion of Immigrants from Burma/Myanmar and unemployment rate among population between the ages 55 and 59 in the United States with a correlation coefficient (R) of 0.116 and weighted average of 4.4%, a difference of 4.5%.
Unemployment Among Ages 55 to 59 years Correlation Summary
| Measurement | Scotch-Irish | Immigrants from Burma/Myanmar |
| Minimum | 4.0% | 0.63% |
| Maximum | 100.0% | 18.8% |
| Range | 96.0% | 18.2% |
| Mean | 21.6% | 4.8% |
| Median | 9.2% | 4.3% |
| Interquartile 25% (IQ1) | 5.3% | 3.1% |
| Interquartile 75% (IQ3) | 26.5% | 5.3% |
| Interquartile Range (IQR) | 21.2% | 2.2% |
| Standard Deviation (Sample) | 26.7% | 2.8% |
| Standard Deviation (Population) | 26.3% | 2.7% |
Similar Demographics by Unemployment Among Ages 55 to 59 years
Demographics Similar to Scotch-Irish by Unemployment Among Ages 55 to 59 years
In terms of unemployment among ages 55 to 59 years, the demographic groups most similar to Scotch-Irish are Immigrants from Bosnia and Herzegovina (4.6%, a difference of 0.010%), Finnish (4.6%, a difference of 0.050%), Immigrants from Iraq (4.6%, a difference of 0.080%), Croatian (4.6%, a difference of 0.10%), and Sri Lankan (4.6%, a difference of 0.14%).
| Demographics | Rating | Rank | Unemployment Among Ages 55 to 59 years |
| Filipinos | 98.8 /100 | #70 | Exceptional 4.6% |
| Immigrants | Jordan | 98.7 /100 | #71 | Exceptional 4.6% |
| Immigrants | Taiwan | 98.7 /100 | #72 | Exceptional 4.6% |
| Bhutanese | 98.6 /100 | #73 | Exceptional 4.6% |
| Croatians | 98.5 /100 | #74 | Exceptional 4.6% |
| Immigrants | Iraq | 98.5 /100 | #75 | Exceptional 4.6% |
| Immigrants | Bosnia and Herzegovina | 98.3 /100 | #76 | Exceptional 4.6% |
| Scotch-Irish | 98.3 /100 | #77 | Exceptional 4.6% |
| Finns | 98.2 /100 | #78 | Exceptional 4.6% |
| Sri Lankans | 98.1 /100 | #79 | Exceptional 4.6% |
| Cambodians | 98.0 /100 | #80 | Exceptional 4.6% |
| Taiwanese | 97.9 /100 | #81 | Exceptional 4.6% |
| Latvians | 97.8 /100 | #82 | Exceptional 4.6% |
| Lebanese | 97.5 /100 | #83 | Exceptional 4.6% |
| Malaysians | 96.9 /100 | #84 | Exceptional 4.7% |
Demographics Similar to Immigrants from Burma/Myanmar by Unemployment Among Ages 55 to 59 years
In terms of unemployment among ages 55 to 59 years, the demographic groups most similar to Immigrants from Burma/Myanmar are Puget Sound Salish (4.4%, a difference of 0.090%), Swedish (4.4%, a difference of 0.24%), Kenyan (4.4%, a difference of 0.25%), Chinese (4.4%, a difference of 0.37%), and Immigrants from Somalia (4.4%, a difference of 0.46%).
| Demographics | Rating | Rank | Unemployment Among Ages 55 to 59 years |
| Bulgarians | 100.0 /100 | #15 | Exceptional 4.3% |
| Somalis | 100.0 /100 | #16 | Exceptional 4.4% |
| Czechs | 100.0 /100 | #17 | Exceptional 4.4% |
| Immigrants | Somalia | 100.0 /100 | #18 | Exceptional 4.4% |
| Chinese | 100.0 /100 | #19 | Exceptional 4.4% |
| Swedes | 100.0 /100 | #20 | Exceptional 4.4% |
| Puget Sound Salish | 100.0 /100 | #21 | Exceptional 4.4% |
| Immigrants | Burma/Myanmar | 100.0 /100 | #22 | Exceptional 4.4% |
| Kenyans | 100.0 /100 | #23 | Exceptional 4.4% |
| Jordanians | 100.0 /100 | #24 | Exceptional 4.4% |
| Immigrants | Eritrea | 100.0 /100 | #25 | Exceptional 4.4% |
| Scandinavians | 99.9 /100 | #26 | Exceptional 4.5% |
| Immigrants | Zimbabwe | 99.9 /100 | #27 | Exceptional 4.5% |
| Immigrants | Eastern Africa | 99.9 /100 | #28 | Exceptional 4.5% |
| Palestinians | 99.9 /100 | #29 | Exceptional 4.5% |