Scandinavian vs Puget Sound Salish Male Poverty
COMPARE
Scandinavian
Puget Sound Salish
Male Poverty
Male Poverty Comparison
Scandinavians
Puget Sound Salish
10.1%
MALE POVERTY
98.0/ 100
METRIC RATING
58th/ 347
METRIC RANK
10.7%
MALE POVERTY
84.3/ 100
METRIC RATING
127th/ 347
METRIC RANK
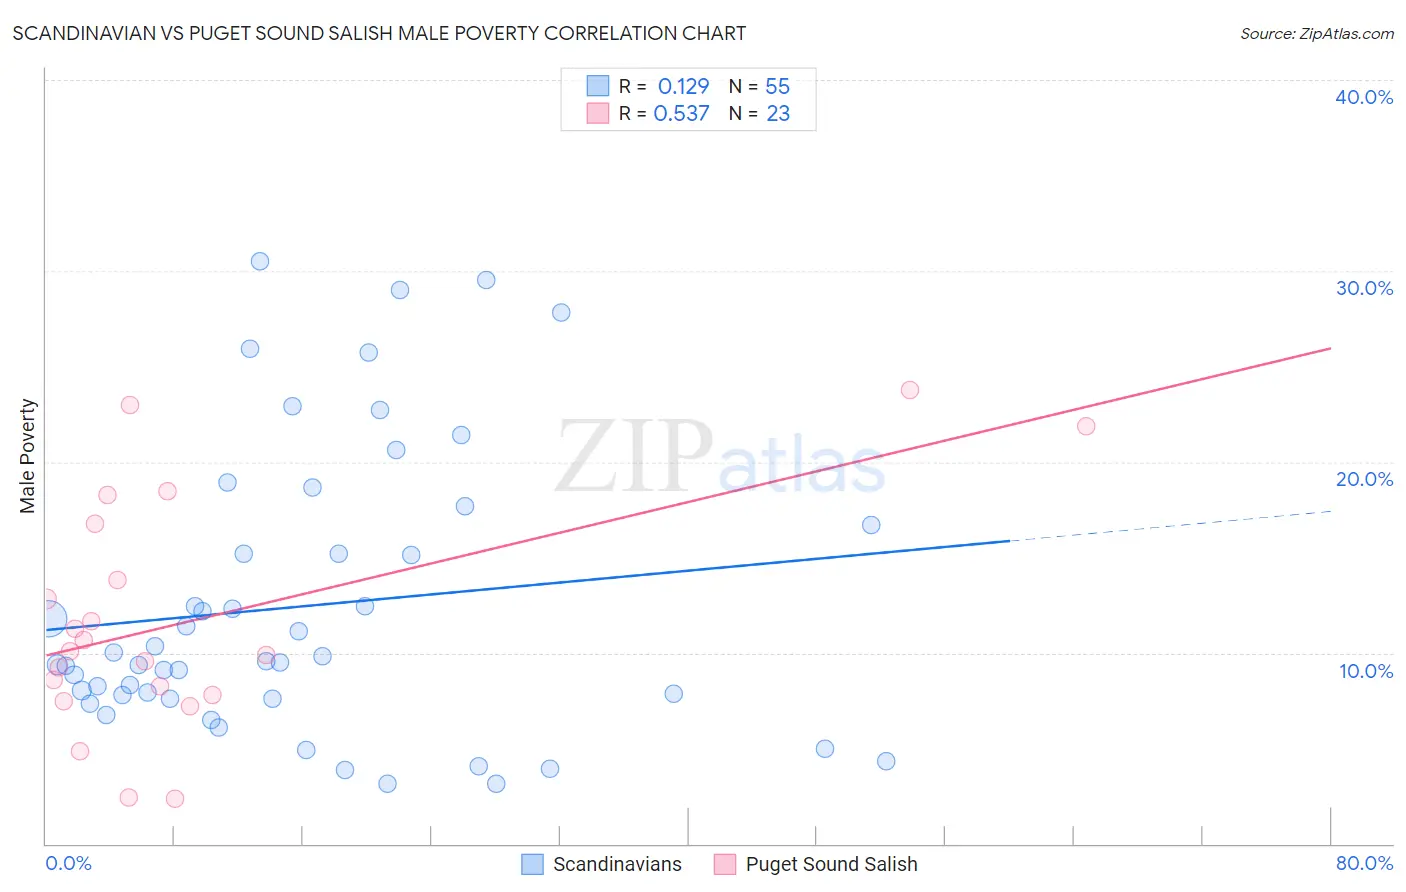
Scandinavian vs Puget Sound Salish Male Poverty Correlation Chart
The statistical analysis conducted on geographies consisting of 471,949,294 people shows a poor positive correlation between the proportion of Scandinavians and poverty level among males in the United States with a correlation coefficient (R) of 0.129 and weighted average of 10.1%. Similarly, the statistical analysis conducted on geographies consisting of 46,147,564 people shows a substantial positive correlation between the proportion of Puget Sound Salish and poverty level among males in the United States with a correlation coefficient (R) of 0.537 and weighted average of 10.7%, a difference of 6.0%.
Male Poverty Correlation Summary
| Measurement | Scandinavian | Puget Sound Salish |
| Minimum | 3.2% | 2.4% |
| Maximum | 30.5% | 23.8% |
| Range | 27.3% | 21.4% |
| Mean | 12.4% | 11.7% |
| Median | 9.6% | 10.1% |
| Interquartile 25% (IQ1) | 7.6% | 7.8% |
| Interquartile 75% (IQ3) | 16.7% | 16.7% |
| Interquartile Range (IQR) | 9.0% | 9.0% |
| Standard Deviation (Sample) | 7.4% | 6.1% |
| Standard Deviation (Population) | 7.3% | 5.9% |
Similar Demographics by Male Poverty
Demographics Similar to Scandinavians by Male Poverty
In terms of male poverty, the demographic groups most similar to Scandinavians are Estonian (10.1%, a difference of 0.070%), Immigrants from Europe (10.1%, a difference of 0.13%), Immigrants from Bulgaria (10.1%, a difference of 0.22%), Ukrainian (10.1%, a difference of 0.22%), and Austrian (10.1%, a difference of 0.24%).
| Demographics | Rating | Rank | Male Poverty |
| Immigrants | Croatia | 98.7 /100 | #51 | Exceptional 10.0% |
| Asians | 98.7 /100 | #52 | Exceptional 10.0% |
| Immigrants | Czechoslovakia | 98.6 /100 | #53 | Exceptional 10.0% |
| Immigrants | Austria | 98.5 /100 | #54 | Exceptional 10.0% |
| Germans | 98.3 /100 | #55 | Exceptional 10.1% |
| Immigrants | Bulgaria | 98.2 /100 | #56 | Exceptional 10.1% |
| Estonians | 98.1 /100 | #57 | Exceptional 10.1% |
| Scandinavians | 98.0 /100 | #58 | Exceptional 10.1% |
| Immigrants | Europe | 97.9 /100 | #59 | Exceptional 10.1% |
| Ukrainians | 97.9 /100 | #60 | Exceptional 10.1% |
| Austrians | 97.8 /100 | #61 | Exceptional 10.1% |
| Immigrants | Italy | 97.8 /100 | #62 | Exceptional 10.2% |
| Slovaks | 97.7 /100 | #63 | Exceptional 10.2% |
| Swiss | 97.5 /100 | #64 | Exceptional 10.2% |
| Zimbabweans | 97.5 /100 | #65 | Exceptional 10.2% |
Demographics Similar to Puget Sound Salish by Male Poverty
In terms of male poverty, the demographic groups most similar to Puget Sound Salish are Immigrants from Ukraine (10.7%, a difference of 0.0%), Immigrants from Western Europe (10.7%, a difference of 0.020%), Immigrants from Peru (10.7%, a difference of 0.030%), Chilean (10.7%, a difference of 0.070%), and Immigrants from Belarus (10.7%, a difference of 0.18%).
| Demographics | Rating | Rank | Male Poverty |
| Immigrants | China | 87.1 /100 | #120 | Excellent 10.7% |
| Peruvians | 87.1 /100 | #121 | Excellent 10.7% |
| Native Hawaiians | 87.0 /100 | #122 | Excellent 10.7% |
| South Africans | 86.8 /100 | #123 | Excellent 10.7% |
| French | 86.7 /100 | #124 | Excellent 10.7% |
| Immigrants | Norway | 86.0 /100 | #125 | Excellent 10.7% |
| Immigrants | Ukraine | 84.3 /100 | #126 | Excellent 10.7% |
| Puget Sound Salish | 84.3 /100 | #127 | Excellent 10.7% |
| Immigrants | Western Europe | 84.2 /100 | #128 | Excellent 10.7% |
| Immigrants | Peru | 84.1 /100 | #129 | Excellent 10.7% |
| Chileans | 83.9 /100 | #130 | Excellent 10.7% |
| Immigrants | Belarus | 83.3 /100 | #131 | Excellent 10.7% |
| Immigrants | Vietnam | 83.0 /100 | #132 | Excellent 10.8% |
| Pakistanis | 83.0 /100 | #133 | Excellent 10.8% |
| New Zealanders | 82.9 /100 | #134 | Excellent 10.8% |