Puget Sound Salish vs Mexican Unemployment
COMPARE
Puget Sound Salish
Mexican
Unemployment
Unemployment Comparison
Puget Sound Salish
Mexicans
5.2%
UNEMPLOYMENT
56.6/ 100
METRIC RATING
171st/ 347
METRIC RANK
5.9%
UNEMPLOYMENT
0.1/ 100
METRIC RATING
271st/ 347
METRIC RANK
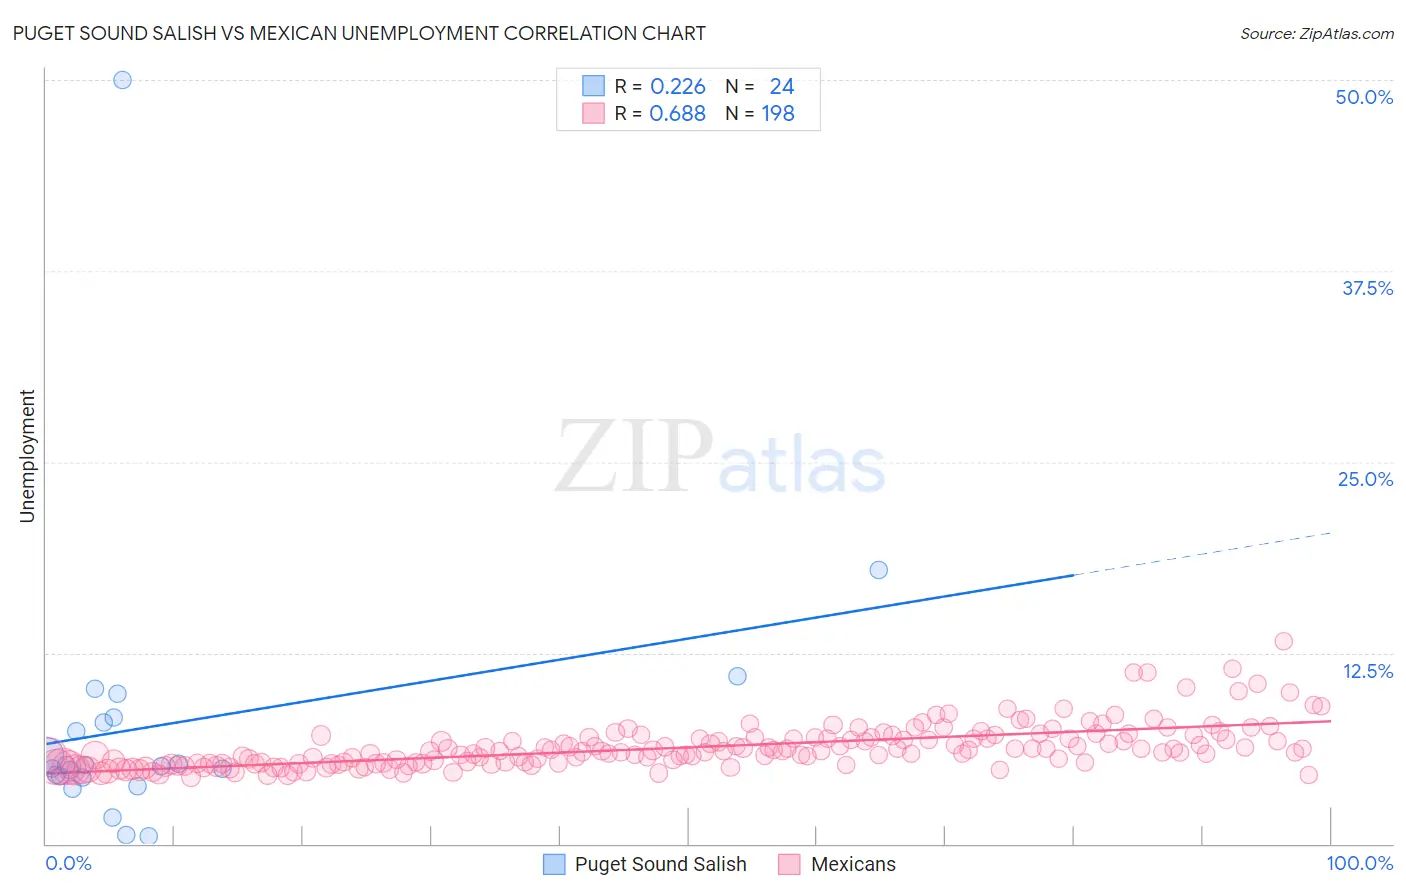
Puget Sound Salish vs Mexican Unemployment Correlation Chart
The statistical analysis conducted on geographies consisting of 46,125,873 people shows a weak positive correlation between the proportion of Puget Sound Salish and unemployment in the United States with a correlation coefficient (R) of 0.226 and weighted average of 5.2%. Similarly, the statistical analysis conducted on geographies consisting of 561,800,236 people shows a significant positive correlation between the proportion of Mexicans and unemployment in the United States with a correlation coefficient (R) of 0.688 and weighted average of 5.9%, a difference of 11.9%.
Unemployment Correlation Summary
| Measurement | Puget Sound Salish | Mexican |
| Minimum | 0.50% | 4.4% |
| Maximum | 50.0% | 13.3% |
| Range | 49.5% | 8.9% |
| Mean | 7.8% | 6.3% |
| Median | 5.1% | 6.0% |
| Interquartile 25% (IQ1) | 4.4% | 5.2% |
| Interquartile 75% (IQ3) | 8.1% | 6.9% |
| Interquartile Range (IQR) | 3.7% | 1.7% |
| Standard Deviation (Sample) | 9.7% | 1.4% |
| Standard Deviation (Population) | 9.5% | 1.4% |
Similar Demographics by Unemployment
Demographics Similar to Puget Sound Salish by Unemployment
In terms of unemployment, the demographic groups most similar to Puget Sound Salish are Immigrants from Nicaragua (5.2%, a difference of 0.040%), Immigrants from Morocco (5.2%, a difference of 0.16%), Uruguayan (5.2%, a difference of 0.23%), Immigrants from Vietnam (5.2%, a difference of 0.25%), and Immigrants from Indonesia (5.2%, a difference of 0.29%).
| Demographics | Rating | Rank | Unemployment |
| Immigrants | Colombia | 64.7 /100 | #164 | Good 5.2% |
| Immigrants | Brazil | 63.1 /100 | #165 | Good 5.2% |
| Immigrants | Indonesia | 61.2 /100 | #166 | Good 5.2% |
| Colombians | 61.1 /100 | #167 | Good 5.2% |
| Uruguayans | 60.2 /100 | #168 | Good 5.2% |
| Immigrants | Morocco | 59.1 /100 | #169 | Average 5.2% |
| Immigrants | Nicaragua | 57.1 /100 | #170 | Average 5.2% |
| Puget Sound Salish | 56.6 /100 | #171 | Average 5.2% |
| Immigrants | Vietnam | 52.5 /100 | #172 | Average 5.2% |
| Immigrants | Poland | 51.8 /100 | #173 | Average 5.3% |
| Immigrants | Congo | 50.0 /100 | #174 | Average 5.3% |
| Taiwanese | 49.6 /100 | #175 | Average 5.3% |
| Nicaraguans | 48.7 /100 | #176 | Average 5.3% |
| Immigrants | Nonimmigrants | 47.9 /100 | #177 | Average 5.3% |
| Afghans | 47.4 /100 | #178 | Average 5.3% |
Demographics Similar to Mexicans by Unemployment
In terms of unemployment, the demographic groups most similar to Mexicans are Blackfeet (5.8%, a difference of 0.23%), Immigrants from El Salvador (5.8%, a difference of 0.31%), Immigrants from Sierra Leone (5.8%, a difference of 0.32%), Immigrants from Nigeria (5.8%, a difference of 0.36%), and Mexican American Indian (5.8%, a difference of 0.43%).
| Demographics | Rating | Rank | Unemployment |
| Immigrants | Liberia | 0.1 /100 | #264 | Tragic 5.8% |
| Nigerians | 0.1 /100 | #265 | Tragic 5.8% |
| Mexican American Indians | 0.1 /100 | #266 | Tragic 5.8% |
| Immigrants | Nigeria | 0.1 /100 | #267 | Tragic 5.8% |
| Immigrants | Sierra Leone | 0.1 /100 | #268 | Tragic 5.8% |
| Immigrants | El Salvador | 0.1 /100 | #269 | Tragic 5.8% |
| Blackfeet | 0.1 /100 | #270 | Tragic 5.8% |
| Mexicans | 0.1 /100 | #271 | Tragic 5.9% |
| Hispanics or Latinos | 0.0 /100 | #272 | Tragic 5.9% |
| Immigrants | Fiji | 0.0 /100 | #273 | Tragic 5.9% |
| Bahamians | 0.0 /100 | #274 | Tragic 5.9% |
| Immigrants | Latin America | 0.0 /100 | #275 | Tragic 5.9% |
| Immigrants | Central America | 0.0 /100 | #276 | Tragic 6.0% |
| Armenians | 0.0 /100 | #277 | Tragic 6.0% |
| Ghanaians | 0.0 /100 | #278 | Tragic 6.0% |