Puget Sound Salish vs Dutch West Indian Unemployment
COMPARE
Puget Sound Salish
Dutch West Indian
Unemployment
Unemployment Comparison
Puget Sound Salish
Dutch West Indians
5.2%
UNEMPLOYMENT
56.6/ 100
METRIC RATING
171st/ 347
METRIC RANK
5.6%
UNEMPLOYMENT
1.2/ 100
METRIC RATING
244th/ 347
METRIC RANK
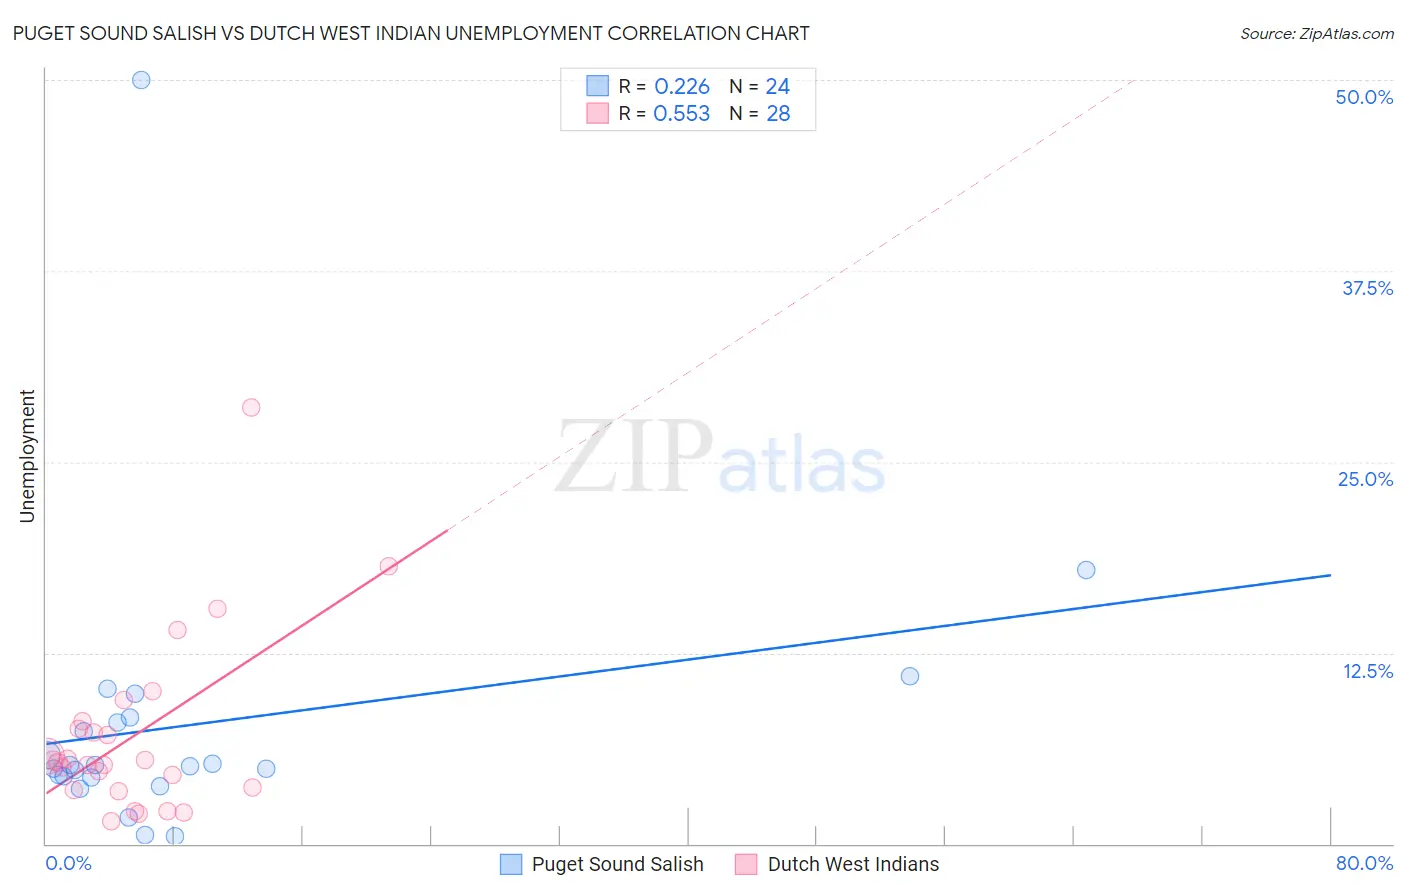
Puget Sound Salish vs Dutch West Indian Unemployment Correlation Chart
The statistical analysis conducted on geographies consisting of 46,125,873 people shows a weak positive correlation between the proportion of Puget Sound Salish and unemployment in the United States with a correlation coefficient (R) of 0.226 and weighted average of 5.2%. Similarly, the statistical analysis conducted on geographies consisting of 85,705,880 people shows a substantial positive correlation between the proportion of Dutch West Indians and unemployment in the United States with a correlation coefficient (R) of 0.553 and weighted average of 5.6%, a difference of 7.2%.
Unemployment Correlation Summary
| Measurement | Puget Sound Salish | Dutch West Indian |
| Minimum | 0.50% | 1.5% |
| Maximum | 50.0% | 28.6% |
| Range | 49.5% | 27.1% |
| Mean | 7.8% | 7.1% |
| Median | 5.1% | 5.4% |
| Interquartile 25% (IQ1) | 4.4% | 3.6% |
| Interquartile 75% (IQ3) | 8.1% | 7.8% |
| Interquartile Range (IQR) | 3.7% | 4.1% |
| Standard Deviation (Sample) | 9.7% | 5.9% |
| Standard Deviation (Population) | 9.5% | 5.7% |
Similar Demographics by Unemployment
Demographics Similar to Puget Sound Salish by Unemployment
In terms of unemployment, the demographic groups most similar to Puget Sound Salish are Immigrants from Nicaragua (5.2%, a difference of 0.040%), Immigrants from Morocco (5.2%, a difference of 0.16%), Uruguayan (5.2%, a difference of 0.23%), Immigrants from Vietnam (5.2%, a difference of 0.25%), and Immigrants from Indonesia (5.2%, a difference of 0.29%).
| Demographics | Rating | Rank | Unemployment |
| Immigrants | Colombia | 64.7 /100 | #164 | Good 5.2% |
| Immigrants | Brazil | 63.1 /100 | #165 | Good 5.2% |
| Immigrants | Indonesia | 61.2 /100 | #166 | Good 5.2% |
| Colombians | 61.1 /100 | #167 | Good 5.2% |
| Uruguayans | 60.2 /100 | #168 | Good 5.2% |
| Immigrants | Morocco | 59.1 /100 | #169 | Average 5.2% |
| Immigrants | Nicaragua | 57.1 /100 | #170 | Average 5.2% |
| Puget Sound Salish | 56.6 /100 | #171 | Average 5.2% |
| Immigrants | Vietnam | 52.5 /100 | #172 | Average 5.2% |
| Immigrants | Poland | 51.8 /100 | #173 | Average 5.3% |
| Immigrants | Congo | 50.0 /100 | #174 | Average 5.3% |
| Taiwanese | 49.6 /100 | #175 | Average 5.3% |
| Nicaraguans | 48.7 /100 | #176 | Average 5.3% |
| Immigrants | Nonimmigrants | 47.9 /100 | #177 | Average 5.3% |
| Afghans | 47.4 /100 | #178 | Average 5.3% |
Demographics Similar to Dutch West Indians by Unemployment
In terms of unemployment, the demographic groups most similar to Dutch West Indians are French American Indian (5.6%, a difference of 0.020%), Bermudan (5.6%, a difference of 0.070%), Marshallese (5.6%, a difference of 0.15%), Immigrants from Cameroon (5.6%, a difference of 0.21%), and Liberian (5.6%, a difference of 0.34%).
| Demographics | Rating | Rank | Unemployment |
| Moroccans | 3.2 /100 | #237 | Tragic 5.5% |
| Immigrants | Western Asia | 2.8 /100 | #238 | Tragic 5.5% |
| Immigrants | Immigrants | 2.6 /100 | #239 | Tragic 5.5% |
| Cree | 2.6 /100 | #240 | Tragic 5.6% |
| Tlingit-Haida | 2.0 /100 | #241 | Tragic 5.6% |
| Spanish Americans | 2.0 /100 | #242 | Tragic 5.6% |
| Marshallese | 1.3 /100 | #243 | Tragic 5.6% |
| Dutch West Indians | 1.2 /100 | #244 | Tragic 5.6% |
| French American Indians | 1.2 /100 | #245 | Tragic 5.6% |
| Bermudans | 1.1 /100 | #246 | Tragic 5.6% |
| Immigrants | Cameroon | 1.0 /100 | #247 | Tragic 5.6% |
| Liberians | 0.9 /100 | #248 | Tragic 5.6% |
| Cajuns | 0.8 /100 | #249 | Tragic 5.6% |
| Japanese | 0.8 /100 | #250 | Tragic 5.6% |
| Kiowa | 0.6 /100 | #251 | Tragic 5.7% |