Puget Sound Salish vs Yuman Unemployment
COMPARE
Puget Sound Salish
Yuman
Unemployment
Unemployment Comparison
Puget Sound Salish
Yuman
5.2%
UNEMPLOYMENT
56.6/ 100
METRIC RATING
171st/ 347
METRIC RANK
9.1%
UNEMPLOYMENT
0.0/ 100
METRIC RATING
343rd/ 347
METRIC RANK
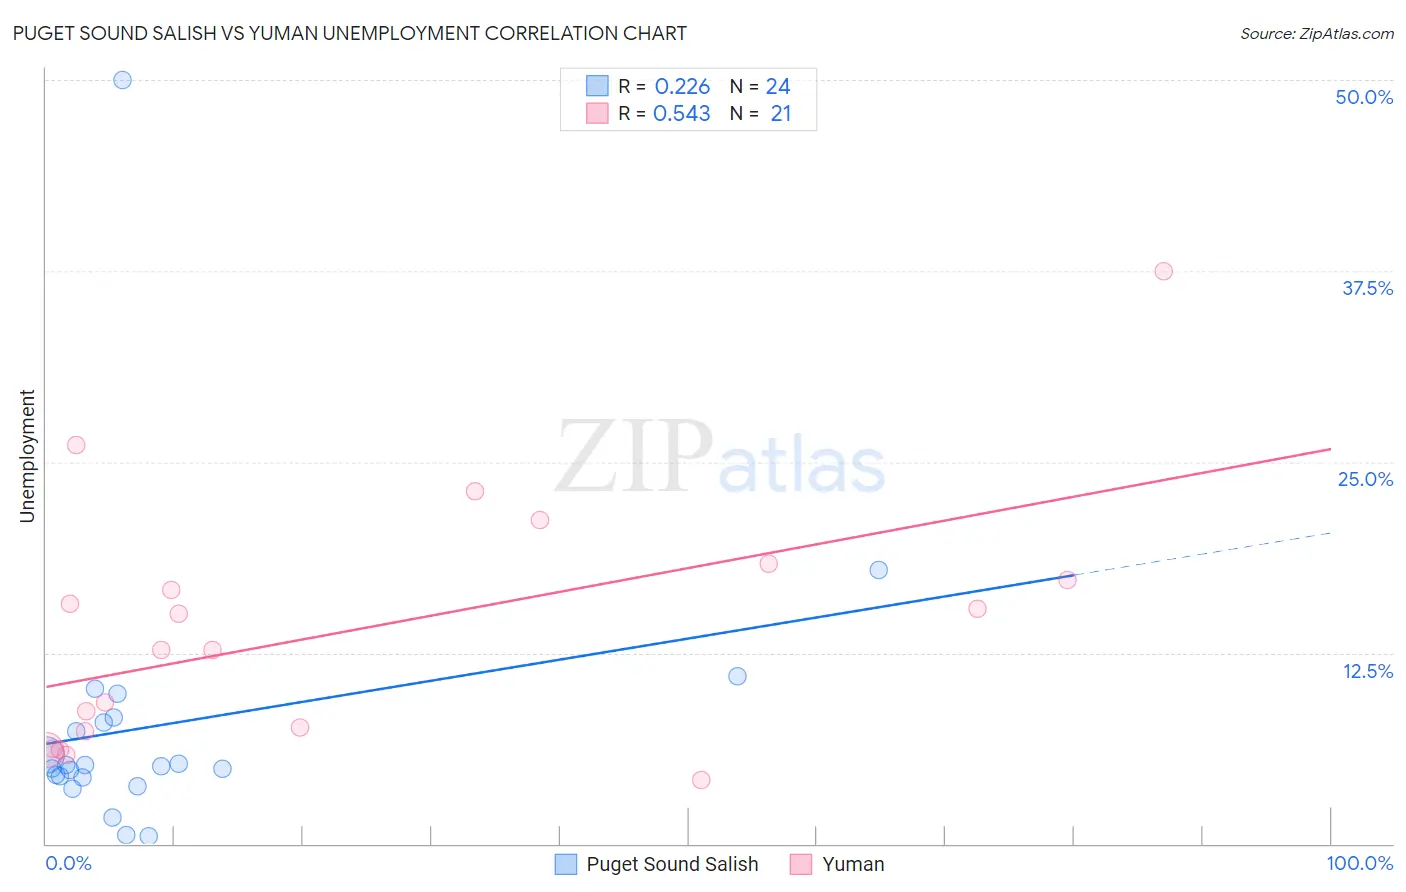
Puget Sound Salish vs Yuman Unemployment Correlation Chart
The statistical analysis conducted on geographies consisting of 46,125,873 people shows a weak positive correlation between the proportion of Puget Sound Salish and unemployment in the United States with a correlation coefficient (R) of 0.226 and weighted average of 5.2%. Similarly, the statistical analysis conducted on geographies consisting of 40,662,591 people shows a substantial positive correlation between the proportion of Yuman and unemployment in the United States with a correlation coefficient (R) of 0.543 and weighted average of 9.1%, a difference of 73.1%.
Unemployment Correlation Summary
| Measurement | Puget Sound Salish | Yuman |
| Minimum | 0.50% | 4.2% |
| Maximum | 50.0% | 37.5% |
| Range | 49.5% | 33.3% |
| Mean | 7.8% | 14.0% |
| Median | 5.1% | 12.7% |
| Interquartile 25% (IQ1) | 4.4% | 6.8% |
| Interquartile 75% (IQ3) | 8.1% | 17.8% |
| Interquartile Range (IQR) | 3.7% | 11.0% |
| Standard Deviation (Sample) | 9.7% | 8.3% |
| Standard Deviation (Population) | 9.5% | 8.1% |
Similar Demographics by Unemployment
Demographics Similar to Puget Sound Salish by Unemployment
In terms of unemployment, the demographic groups most similar to Puget Sound Salish are Immigrants from Nicaragua (5.2%, a difference of 0.040%), Immigrants from Morocco (5.2%, a difference of 0.16%), Uruguayan (5.2%, a difference of 0.23%), Immigrants from Vietnam (5.2%, a difference of 0.25%), and Immigrants from Indonesia (5.2%, a difference of 0.29%).
| Demographics | Rating | Rank | Unemployment |
| Immigrants | Colombia | 64.7 /100 | #164 | Good 5.2% |
| Immigrants | Brazil | 63.1 /100 | #165 | Good 5.2% |
| Immigrants | Indonesia | 61.2 /100 | #166 | Good 5.2% |
| Colombians | 61.1 /100 | #167 | Good 5.2% |
| Uruguayans | 60.2 /100 | #168 | Good 5.2% |
| Immigrants | Morocco | 59.1 /100 | #169 | Average 5.2% |
| Immigrants | Nicaragua | 57.1 /100 | #170 | Average 5.2% |
| Puget Sound Salish | 56.6 /100 | #171 | Average 5.2% |
| Immigrants | Vietnam | 52.5 /100 | #172 | Average 5.2% |
| Immigrants | Poland | 51.8 /100 | #173 | Average 5.3% |
| Immigrants | Congo | 50.0 /100 | #174 | Average 5.3% |
| Taiwanese | 49.6 /100 | #175 | Average 5.3% |
| Nicaraguans | 48.7 /100 | #176 | Average 5.3% |
| Immigrants | Nonimmigrants | 47.9 /100 | #177 | Average 5.3% |
| Afghans | 47.4 /100 | #178 | Average 5.3% |
Demographics Similar to Yuman by Unemployment
In terms of unemployment, the demographic groups most similar to Yuman are Hopi (8.9%, a difference of 1.7%), Tohono O'odham (8.9%, a difference of 2.1%), Puerto Rican (8.4%, a difference of 7.7%), Arapaho (9.8%, a difference of 8.4%), and Navajo (8.4%, a difference of 8.5%).
| Demographics | Rating | Rank | Unemployment |
| Immigrants | Dominican Republic | 0.0 /100 | #333 | Tragic 7.4% |
| Apache | 0.0 /100 | #334 | Tragic 7.4% |
| Alaskan Athabascans | 0.0 /100 | #335 | Tragic 7.7% |
| Immigrants | Yemen | 0.0 /100 | #336 | Tragic 7.7% |
| Cheyenne | 0.0 /100 | #337 | Tragic 8.0% |
| Pima | 0.0 /100 | #338 | Tragic 8.2% |
| Navajo | 0.0 /100 | #339 | Tragic 8.4% |
| Puerto Ricans | 0.0 /100 | #340 | Tragic 8.4% |
| Tohono O'odham | 0.0 /100 | #341 | Tragic 8.9% |
| Hopi | 0.0 /100 | #342 | Tragic 8.9% |
| Yuman | 0.0 /100 | #343 | Tragic 9.1% |
| Arapaho | 0.0 /100 | #344 | Tragic 9.8% |
| Inupiat | 0.0 /100 | #345 | Tragic 10.1% |
| Crow | 0.0 /100 | #346 | Tragic 11.1% |
| Yup'ik | 0.0 /100 | #347 | Tragic 13.6% |