Panamanian vs New Zealander Male Unemployment
COMPARE
Panamanian
New Zealander
Male Unemployment
Male Unemployment Comparison
Panamanians
New Zealanders
5.6%
MALE UNEMPLOYMENT
1.9/ 100
METRIC RATING
225th/ 347
METRIC RANK
5.0%
MALE UNEMPLOYMENT
97.3/ 100
METRIC RATING
71st/ 347
METRIC RANK
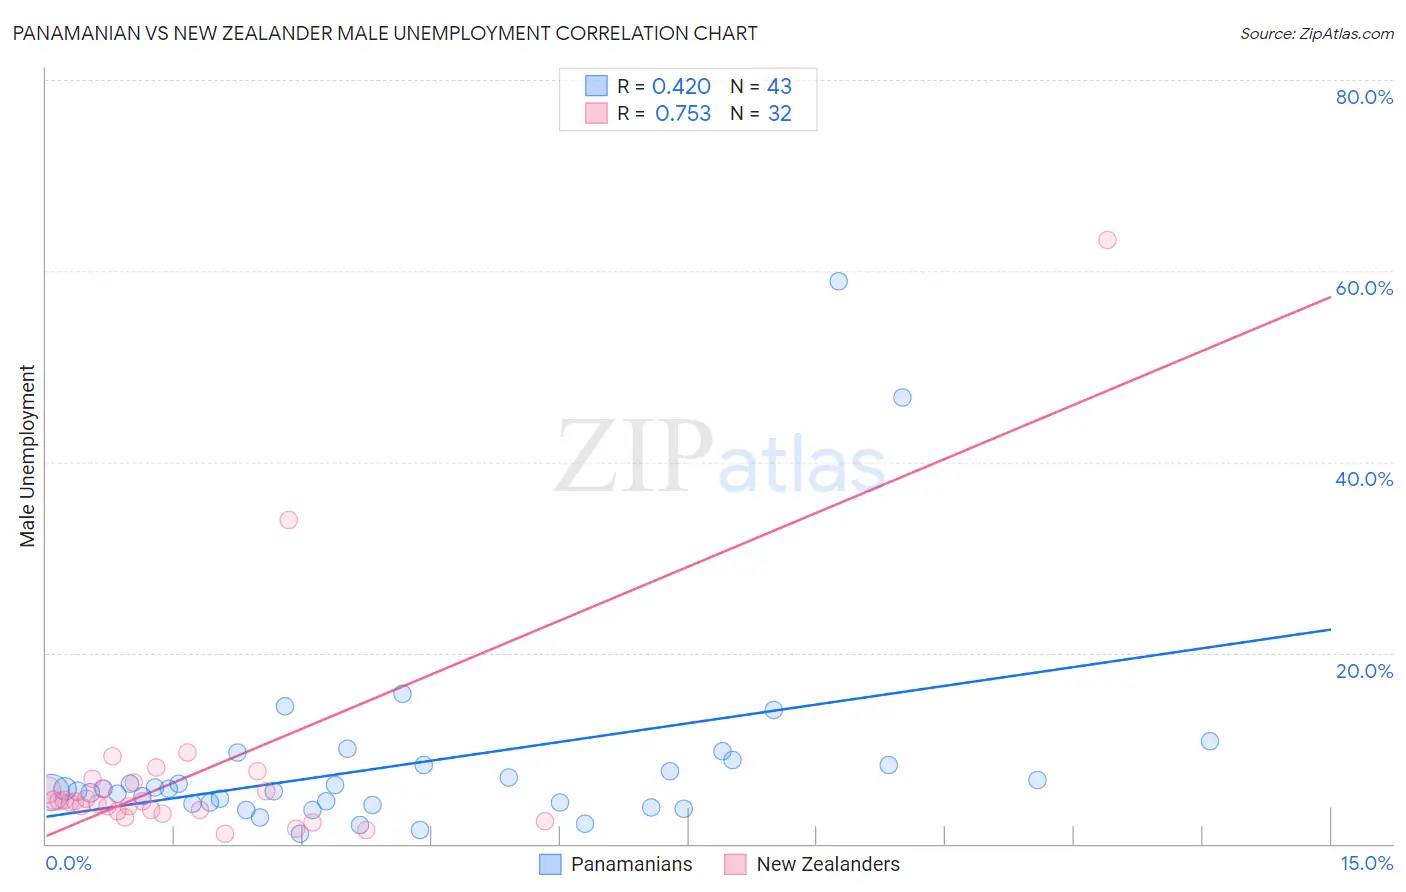
Panamanian vs New Zealander Male Unemployment Correlation Chart
The statistical analysis conducted on geographies consisting of 280,561,708 people shows a moderate positive correlation between the proportion of Panamanians and unemployment rate among males in the United States with a correlation coefficient (R) of 0.420 and weighted average of 5.6%. Similarly, the statistical analysis conducted on geographies consisting of 106,769,284 people shows a strong positive correlation between the proportion of New Zealanders and unemployment rate among males in the United States with a correlation coefficient (R) of 0.753 and weighted average of 5.0%, a difference of 11.6%.
Male Unemployment Correlation Summary
| Measurement | Panamanian | New Zealander |
| Minimum | 1.0% | 1.1% |
| Maximum | 58.9% | 63.2% |
| Range | 57.9% | 62.1% |
| Mean | 8.4% | 7.3% |
| Median | 5.8% | 4.4% |
| Interquartile 25% (IQ1) | 4.2% | 3.5% |
| Interquartile 75% (IQ3) | 8.3% | 6.1% |
| Interquartile Range (IQR) | 4.1% | 2.6% |
| Standard Deviation (Sample) | 10.5% | 11.6% |
| Standard Deviation (Population) | 10.4% | 11.4% |
Similar Demographics by Male Unemployment
Demographics Similar to Panamanians by Male Unemployment
In terms of male unemployment, the demographic groups most similar to Panamanians are Immigrants from Cambodia (5.6%, a difference of 0.090%), Immigrants from Panama (5.6%, a difference of 0.090%), Seminole (5.6%, a difference of 0.11%), Central American (5.6%, a difference of 0.11%), and Immigrants from Africa (5.6%, a difference of 0.15%).
| Demographics | Rating | Rank | Male Unemployment |
| Immigrants | Albania | 3.6 /100 | #218 | Tragic 5.5% |
| Immigrants | Western Asia | 3.5 /100 | #219 | Tragic 5.6% |
| Portuguese | 3.5 /100 | #220 | Tragic 5.6% |
| Soviet Union | 3.2 /100 | #221 | Tragic 5.6% |
| Immigrants | Micronesia | 2.9 /100 | #222 | Tragic 5.6% |
| Creek | 2.6 /100 | #223 | Tragic 5.6% |
| Cherokee | 2.4 /100 | #224 | Tragic 5.6% |
| Panamanians | 1.9 /100 | #225 | Tragic 5.6% |
| Immigrants | Cambodia | 1.8 /100 | #226 | Tragic 5.6% |
| Immigrants | Panama | 1.8 /100 | #227 | Tragic 5.6% |
| Seminole | 1.8 /100 | #228 | Tragic 5.6% |
| Central Americans | 1.8 /100 | #229 | Tragic 5.6% |
| Immigrants | Africa | 1.7 /100 | #230 | Tragic 5.6% |
| Choctaw | 1.6 /100 | #231 | Tragic 5.6% |
| Moroccans | 1.6 /100 | #232 | Tragic 5.6% |
Demographics Similar to New Zealanders by Male Unemployment
In terms of male unemployment, the demographic groups most similar to New Zealanders are White/Caucasian (5.0%, a difference of 0.020%), Immigrants from Sweden (5.0%, a difference of 0.070%), Immigrants from South Africa (5.0%, a difference of 0.070%), Australian (5.0%, a difference of 0.10%), and Immigrants from Canada (5.0%, a difference of 0.11%).
| Demographics | Rating | Rank | Male Unemployment |
| Celtics | 97.8 /100 | #64 | Exceptional 5.0% |
| Icelanders | 97.6 /100 | #65 | Exceptional 5.0% |
| Finns | 97.5 /100 | #66 | Exceptional 5.0% |
| Immigrants | Canada | 97.5 /100 | #67 | Exceptional 5.0% |
| Australians | 97.4 /100 | #68 | Exceptional 5.0% |
| Immigrants | Sweden | 97.4 /100 | #69 | Exceptional 5.0% |
| Whites/Caucasians | 97.3 /100 | #70 | Exceptional 5.0% |
| New Zealanders | 97.3 /100 | #71 | Exceptional 5.0% |
| Immigrants | South Africa | 97.1 /100 | #72 | Exceptional 5.0% |
| Greeks | 97.0 /100 | #73 | Exceptional 5.0% |
| Immigrants | North America | 96.9 /100 | #74 | Exceptional 5.0% |
| Assyrians/Chaldeans/Syriacs | 96.9 /100 | #75 | Exceptional 5.0% |
| Immigrants | Sudan | 96.5 /100 | #76 | Exceptional 5.0% |
| Iranians | 96.4 /100 | #77 | Exceptional 5.0% |
| Immigrants | Northern Europe | 96.4 /100 | #78 | Exceptional 5.0% |