Panamanian vs Lebanese Male Unemployment
COMPARE
Panamanian
Lebanese
Male Unemployment
Male Unemployment Comparison
Panamanians
Lebanese
5.6%
MALE UNEMPLOYMENT
1.9/ 100
METRIC RATING
225th/ 347
METRIC RANK
5.2%
MALE UNEMPLOYMENT
79.9/ 100
METRIC RATING
136th/ 347
METRIC RANK
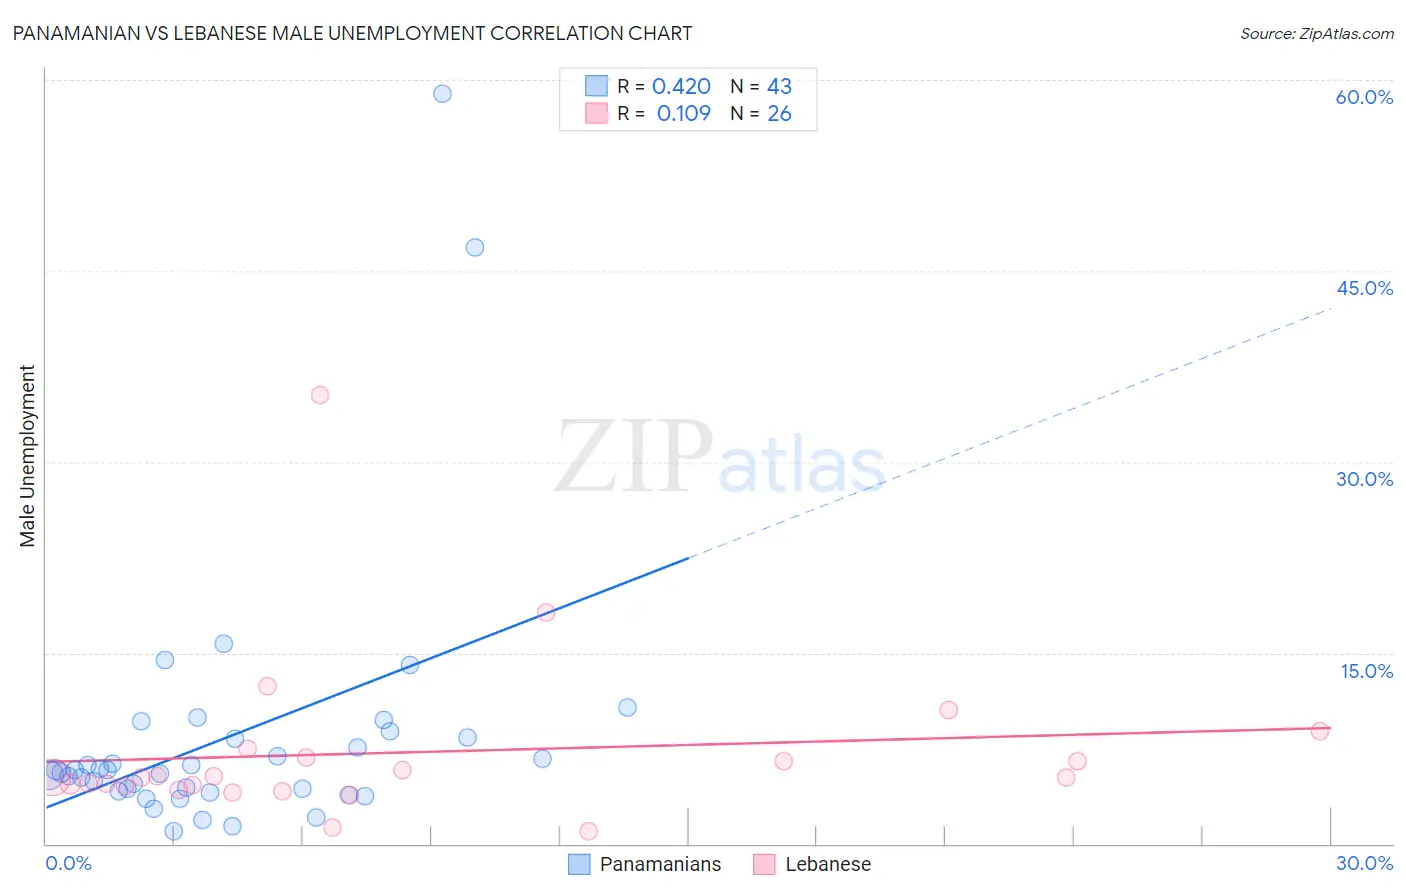
Panamanian vs Lebanese Male Unemployment Correlation Chart
The statistical analysis conducted on geographies consisting of 280,561,708 people shows a moderate positive correlation between the proportion of Panamanians and unemployment rate among males in the United States with a correlation coefficient (R) of 0.420 and weighted average of 5.6%. Similarly, the statistical analysis conducted on geographies consisting of 399,936,199 people shows a poor positive correlation between the proportion of Lebanese and unemployment rate among males in the United States with a correlation coefficient (R) of 0.109 and weighted average of 5.2%, a difference of 7.9%.
Male Unemployment Correlation Summary
| Measurement | Panamanian | Lebanese |
| Minimum | 1.0% | 1.0% |
| Maximum | 58.9% | 35.3% |
| Range | 57.9% | 34.3% |
| Mean | 8.4% | 7.2% |
| Median | 5.8% | 5.2% |
| Interquartile 25% (IQ1) | 4.2% | 4.5% |
| Interquartile 75% (IQ3) | 8.3% | 6.8% |
| Interquartile Range (IQR) | 4.1% | 2.2% |
| Standard Deviation (Sample) | 10.5% | 6.7% |
| Standard Deviation (Population) | 10.4% | 6.6% |
Similar Demographics by Male Unemployment
Demographics Similar to Panamanians by Male Unemployment
In terms of male unemployment, the demographic groups most similar to Panamanians are Immigrants from Cambodia (5.6%, a difference of 0.090%), Immigrants from Panama (5.6%, a difference of 0.090%), Seminole (5.6%, a difference of 0.11%), Central American (5.6%, a difference of 0.11%), and Immigrants from Africa (5.6%, a difference of 0.15%).
| Demographics | Rating | Rank | Male Unemployment |
| Immigrants | Albania | 3.6 /100 | #218 | Tragic 5.5% |
| Immigrants | Western Asia | 3.5 /100 | #219 | Tragic 5.6% |
| Portuguese | 3.5 /100 | #220 | Tragic 5.6% |
| Soviet Union | 3.2 /100 | #221 | Tragic 5.6% |
| Immigrants | Micronesia | 2.9 /100 | #222 | Tragic 5.6% |
| Creek | 2.6 /100 | #223 | Tragic 5.6% |
| Cherokee | 2.4 /100 | #224 | Tragic 5.6% |
| Panamanians | 1.9 /100 | #225 | Tragic 5.6% |
| Immigrants | Cambodia | 1.8 /100 | #226 | Tragic 5.6% |
| Immigrants | Panama | 1.8 /100 | #227 | Tragic 5.6% |
| Seminole | 1.8 /100 | #228 | Tragic 5.6% |
| Central Americans | 1.8 /100 | #229 | Tragic 5.6% |
| Immigrants | Africa | 1.7 /100 | #230 | Tragic 5.6% |
| Choctaw | 1.6 /100 | #231 | Tragic 5.6% |
| Moroccans | 1.6 /100 | #232 | Tragic 5.6% |
Demographics Similar to Lebanese by Male Unemployment
In terms of male unemployment, the demographic groups most similar to Lebanese are Immigrants from Eastern Africa (5.2%, a difference of 0.010%), Immigrants from Saudi Arabia (5.2%, a difference of 0.020%), Immigrants from Croatia (5.2%, a difference of 0.020%), Kenyan (5.2%, a difference of 0.040%), and Pakistani (5.2%, a difference of 0.050%).
| Demographics | Rating | Rank | Male Unemployment |
| Immigrants | Western Europe | 84.8 /100 | #129 | Excellent 5.2% |
| Immigrants | Malaysia | 83.5 /100 | #130 | Excellent 5.2% |
| Immigrants | Germany | 83.0 /100 | #131 | Excellent 5.2% |
| Chickasaw | 82.9 /100 | #132 | Excellent 5.2% |
| Colombians | 81.1 /100 | #133 | Excellent 5.2% |
| Pakistanis | 80.5 /100 | #134 | Excellent 5.2% |
| Immigrants | Saudi Arabia | 80.1 /100 | #135 | Excellent 5.2% |
| Lebanese | 79.9 /100 | #136 | Good 5.2% |
| Immigrants | Eastern Africa | 79.8 /100 | #137 | Good 5.2% |
| Immigrants | Croatia | 79.7 /100 | #138 | Good 5.2% |
| Kenyans | 79.4 /100 | #139 | Good 5.2% |
| Brazilians | 79.3 /100 | #140 | Good 5.2% |
| Immigrants | Switzerland | 79.2 /100 | #141 | Good 5.2% |
| Fijians | 78.3 /100 | #142 | Good 5.2% |
| Syrians | 78.0 /100 | #143 | Good 5.2% |