New Zealander vs Immigrants from France Male Unemployment
COMPARE
New Zealander
Immigrants from France
Male Unemployment
Male Unemployment Comparison
New Zealanders
Immigrants from France
5.0%
MALE UNEMPLOYMENT
97.3/ 100
METRIC RATING
71st/ 347
METRIC RANK
5.1%
MALE UNEMPLOYMENT
92.7/ 100
METRIC RATING
102nd/ 347
METRIC RANK
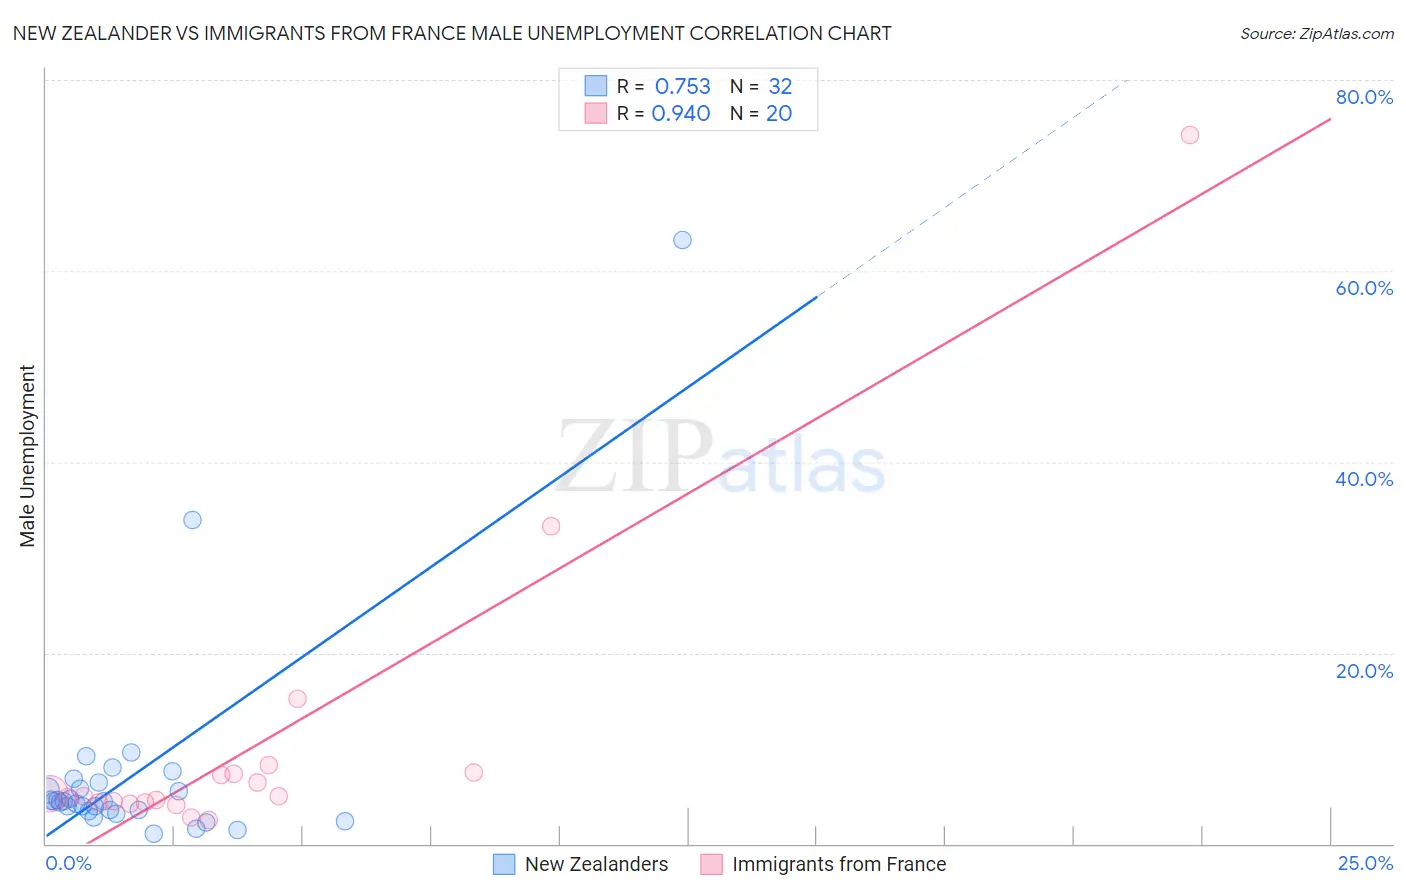
New Zealander vs Immigrants from France Male Unemployment Correlation Chart
The statistical analysis conducted on geographies consisting of 106,769,284 people shows a strong positive correlation between the proportion of New Zealanders and unemployment rate among males in the United States with a correlation coefficient (R) of 0.753 and weighted average of 5.0%. Similarly, the statistical analysis conducted on geographies consisting of 287,192,978 people shows a near-perfect positive correlation between the proportion of Immigrants from France and unemployment rate among males in the United States with a correlation coefficient (R) of 0.940 and weighted average of 5.1%, a difference of 1.6%.
Male Unemployment Correlation Summary
| Measurement | New Zealander | Immigrants from France |
| Minimum | 1.1% | 2.5% |
| Maximum | 63.2% | 74.2% |
| Range | 62.1% | 71.7% |
| Mean | 7.3% | 10.5% |
| Median | 4.4% | 5.0% |
| Interquartile 25% (IQ1) | 3.5% | 4.3% |
| Interquartile 75% (IQ3) | 6.1% | 7.4% |
| Interquartile Range (IQR) | 2.6% | 3.1% |
| Standard Deviation (Sample) | 11.6% | 16.4% |
| Standard Deviation (Population) | 11.4% | 16.0% |
Similar Demographics by Male Unemployment
Demographics Similar to New Zealanders by Male Unemployment
In terms of male unemployment, the demographic groups most similar to New Zealanders are White/Caucasian (5.0%, a difference of 0.020%), Immigrants from Sweden (5.0%, a difference of 0.070%), Immigrants from South Africa (5.0%, a difference of 0.070%), Australian (5.0%, a difference of 0.10%), and Immigrants from Canada (5.0%, a difference of 0.11%).
| Demographics | Rating | Rank | Male Unemployment |
| Celtics | 97.8 /100 | #64 | Exceptional 5.0% |
| Icelanders | 97.6 /100 | #65 | Exceptional 5.0% |
| Finns | 97.5 /100 | #66 | Exceptional 5.0% |
| Immigrants | Canada | 97.5 /100 | #67 | Exceptional 5.0% |
| Australians | 97.4 /100 | #68 | Exceptional 5.0% |
| Immigrants | Sweden | 97.4 /100 | #69 | Exceptional 5.0% |
| Whites/Caucasians | 97.3 /100 | #70 | Exceptional 5.0% |
| New Zealanders | 97.3 /100 | #71 | Exceptional 5.0% |
| Immigrants | South Africa | 97.1 /100 | #72 | Exceptional 5.0% |
| Greeks | 97.0 /100 | #73 | Exceptional 5.0% |
| Immigrants | North America | 96.9 /100 | #74 | Exceptional 5.0% |
| Assyrians/Chaldeans/Syriacs | 96.9 /100 | #75 | Exceptional 5.0% |
| Immigrants | Sudan | 96.5 /100 | #76 | Exceptional 5.0% |
| Iranians | 96.4 /100 | #77 | Exceptional 5.0% |
| Immigrants | Northern Europe | 96.4 /100 | #78 | Exceptional 5.0% |
Demographics Similar to Immigrants from France by Male Unemployment
In terms of male unemployment, the demographic groups most similar to Immigrants from France are German Russian (5.1%, a difference of 0.020%), Russian (5.1%, a difference of 0.060%), Uruguayan (5.1%, a difference of 0.070%), Immigrants from Kuwait (5.1%, a difference of 0.14%), and Immigrants from Jordan (5.1%, a difference of 0.16%).
| Demographics | Rating | Rank | Male Unemployment |
| Italians | 93.8 /100 | #95 | Exceptional 5.1% |
| Asians | 93.7 /100 | #96 | Exceptional 5.1% |
| Immigrants | Spain | 93.4 /100 | #97 | Exceptional 5.1% |
| Immigrants | Kuwait | 93.3 /100 | #98 | Exceptional 5.1% |
| Uruguayans | 93.0 /100 | #99 | Exceptional 5.1% |
| Russians | 92.9 /100 | #100 | Exceptional 5.1% |
| German Russians | 92.7 /100 | #101 | Exceptional 5.1% |
| Immigrants | France | 92.7 /100 | #102 | Exceptional 5.1% |
| Immigrants | Jordan | 91.9 /100 | #103 | Exceptional 5.1% |
| Immigrants | Chile | 91.8 /100 | #104 | Exceptional 5.1% |
| Immigrants | Czechoslovakia | 91.7 /100 | #105 | Exceptional 5.1% |
| Immigrants | Ethiopia | 91.5 /100 | #106 | Exceptional 5.1% |
| Ethiopians | 91.3 /100 | #107 | Exceptional 5.1% |
| Immigrants | Nicaragua | 91.2 /100 | #108 | Exceptional 5.1% |
| Immigrants | Pakistan | 90.9 /100 | #109 | Exceptional 5.1% |